AVGO Daily Technical Analysis
Broadcom Inc
Designs semiconductors and enterprise software following its VMware acquisition.
AVGO Technical Analysis Summary
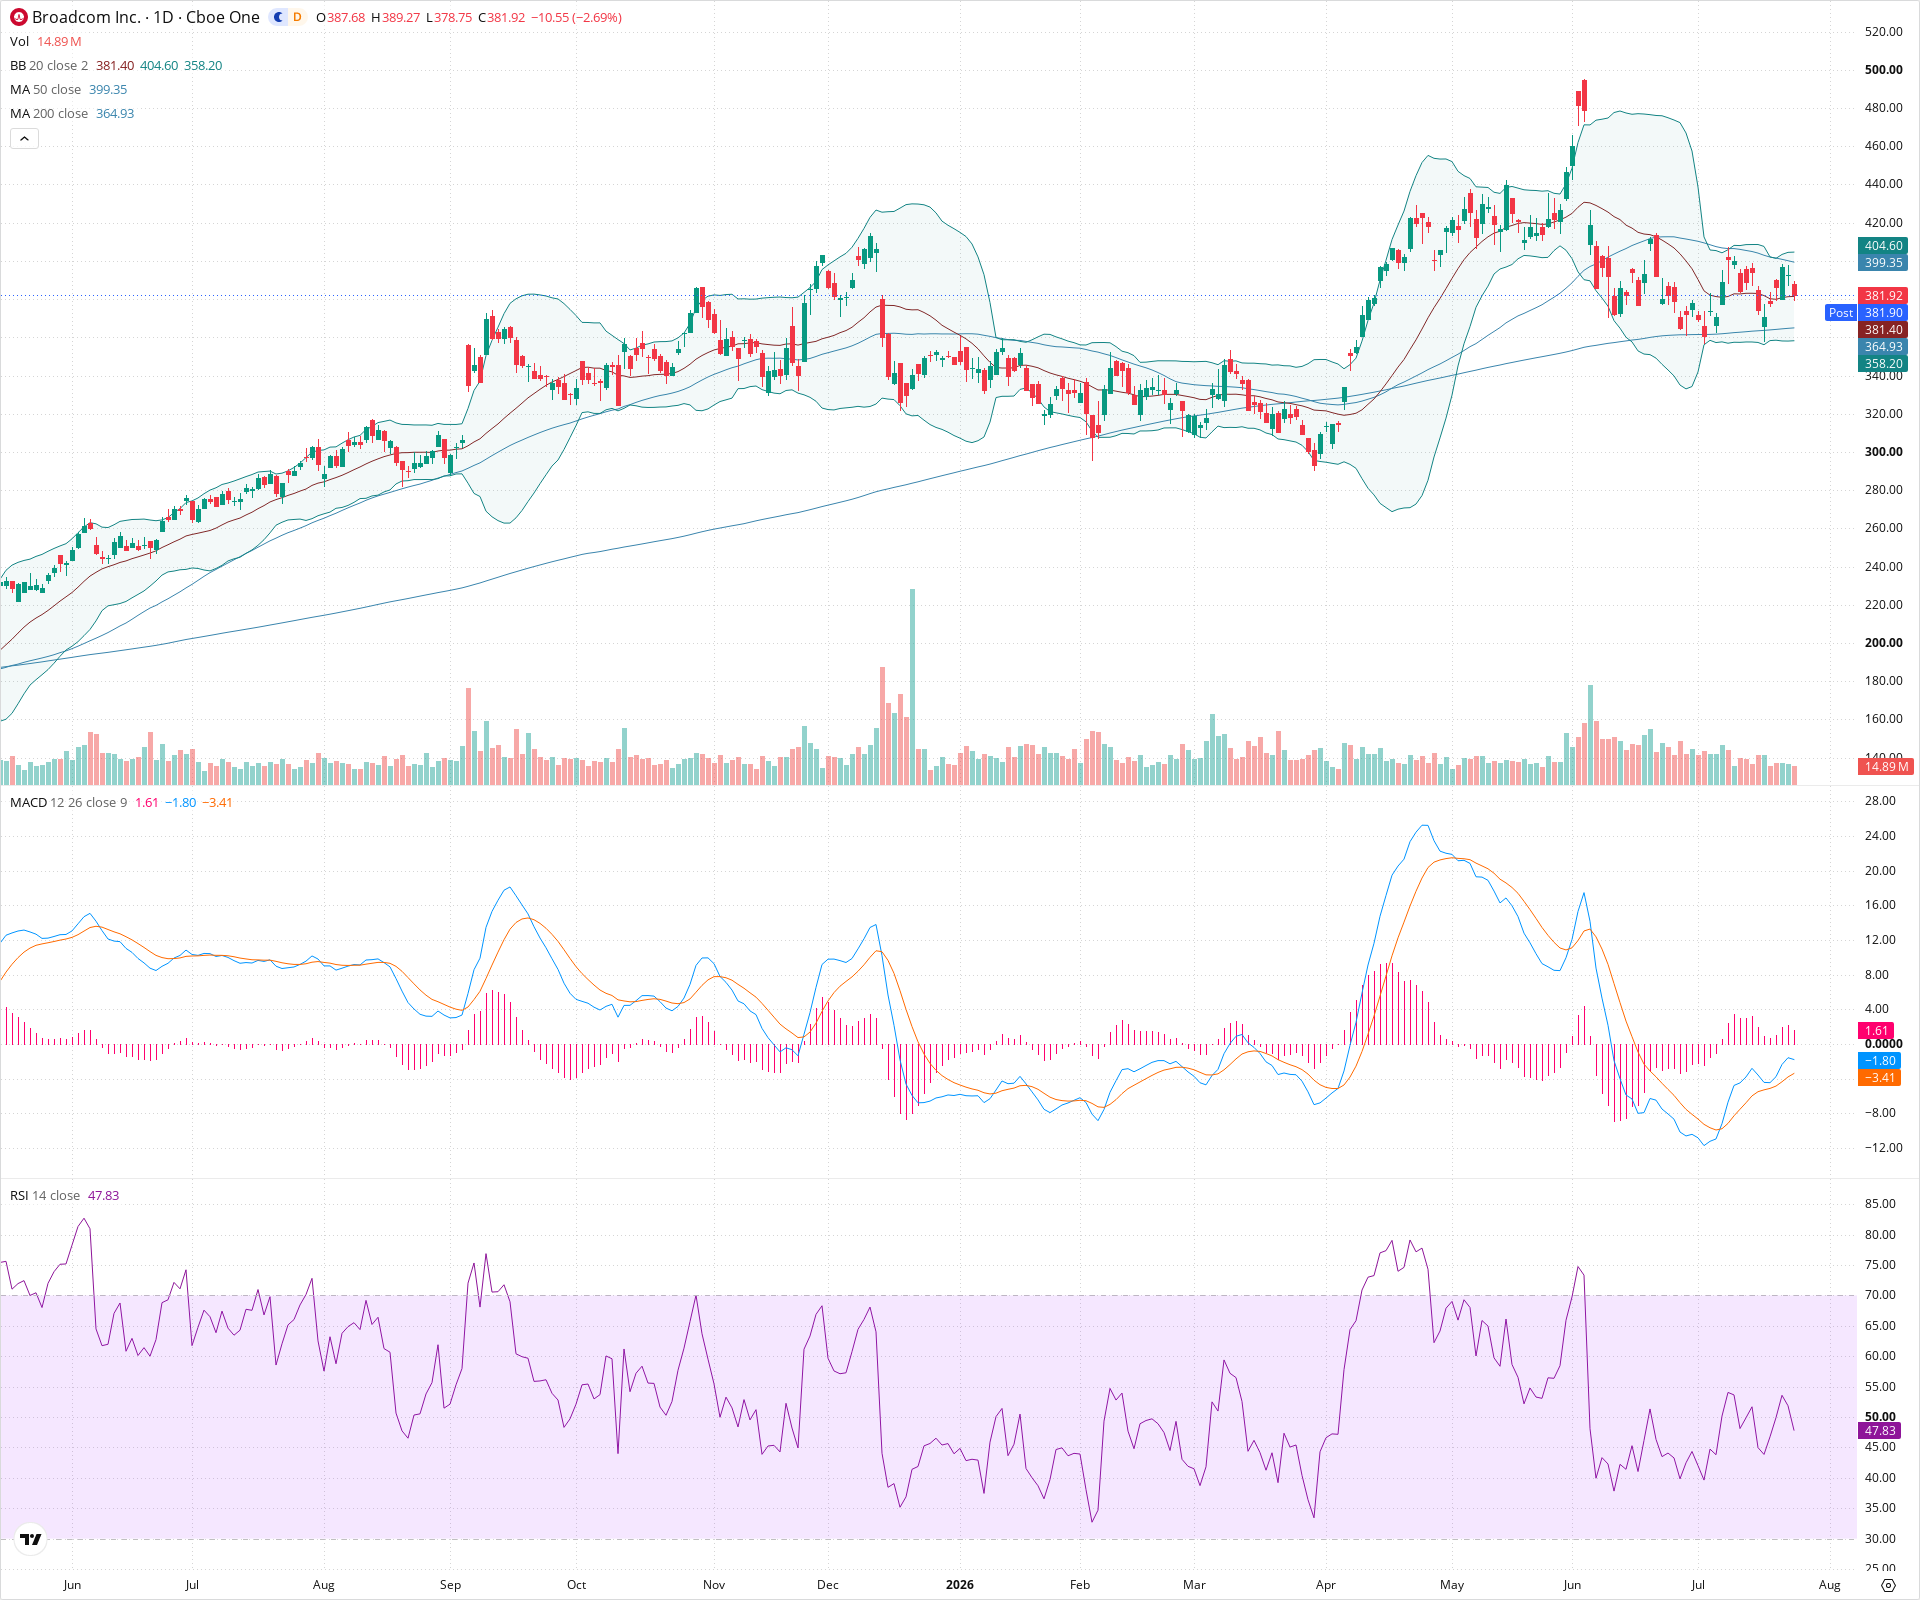
AVGO is currently undergoing a significant corrective phase following an extreme parabolic advance and subsequent sharp sell-off. In the near term, the stock is trapped between its 50-day and 200-day moving averages, suggesting a period of consolidation or distribution. Long-term investors will be watching closely to see if the rising 200-day SMA near 365 can hold as support to maintain the primary bullish trend.
Included In Lists
Related Tickers of Interest
AVGO Daily Chart
Sentiment
Short-term Sentiment (days to weeks): Bearish
Price is currently trading below the 50-day SMA and has recently established a lower high relative to the peak. RSI is slightly below 50 and sloping downwards, indicating weak momentum.
Long-term Sentiment (weeks to months): Bullish
Despite the recent significant pullback, the price remains above a firmly upward-sloping 200-day SMA, preserving the broader long-term uptrend structure.
Report Metadata
- Timeframe: daily
- Generated at: 2026-07-24T21:16:02.998Z
- Model: gemini-3.1-pro-preview
Support Price Levels
| Level | Range | Strength | Notes |
|---|---|---|---|
| $362.50 | $360.00 - $365.00 | Strong | Convergence of the 200-day SMA and a recent swing low area. |
| $345.00 | $340.00 - $350.00 | Strong | Major prior consolidation zone from earlier in the year. |
Resistance Price Levels
| Level | Range | Strength | Notes |
|---|---|---|---|
| $400.00 | $395.00 - $405.00 | Strong | Zone containing the 50-day SMA and the Upper Bollinger Band. |
| $430.00 | $425.00 - $435.00 | Moderate | Recent intermediate swing high where price was heavily rejected. |
| $487.50 | $475.00 - $500.00 | Strong | All-time high peak and massive gap-down origin zone. |
Potential Chart Patterns in Formation
| Strength | Pattern | Signal | Target | Details |
|---|---|---|---|---|
| Strong | Lower High Formation | Bearish | N/A | The recent rally failed around 430, forming a distinct lower high compared to the massive peak near 500, indicating a shift in momentum to the downside. |
| Moderate | Moving Average Channel | Neutral | N/A | Price is currently compressed and consolidating between the overhead resistance of the 50-day SMA and the underlying support of the 200-day SMA. |
Frequently Asked Questions about AVGO
What is the current sentiment for AVGO?
The short-term sentiment for AVGO is currently Bearish because Price is currently trading below the 50-day SMA and has recently established a lower high relative to the peak. RSI is slightly below 50 and sloping downwards, indicating weak momentum.. The long-term trend is classified as Bullish.
What are the key support levels for AVGO?
StockDips.AI has identified key support levels for AVGO at $362.50 and $345.00. These levels may represent potential accumulation zones where buying interest could emerge.
Is AVGO in a significant dip or a Value Dip right now?
AVGO has a Value Score of 48/100. It is not currently flagged as a significant dip in the Top Dips list. It is not listed as a Value Dip because the long-term sentiment or value-score threshold does not qualify.
View the full interactive analysis on StockDips.AI.