XYZ Weekly Technical Analysis
Block, Inc
Block operates an ecosystem of financial products and services: Square, Cash App, Afterpay
XYZ Technical Analysis Summary
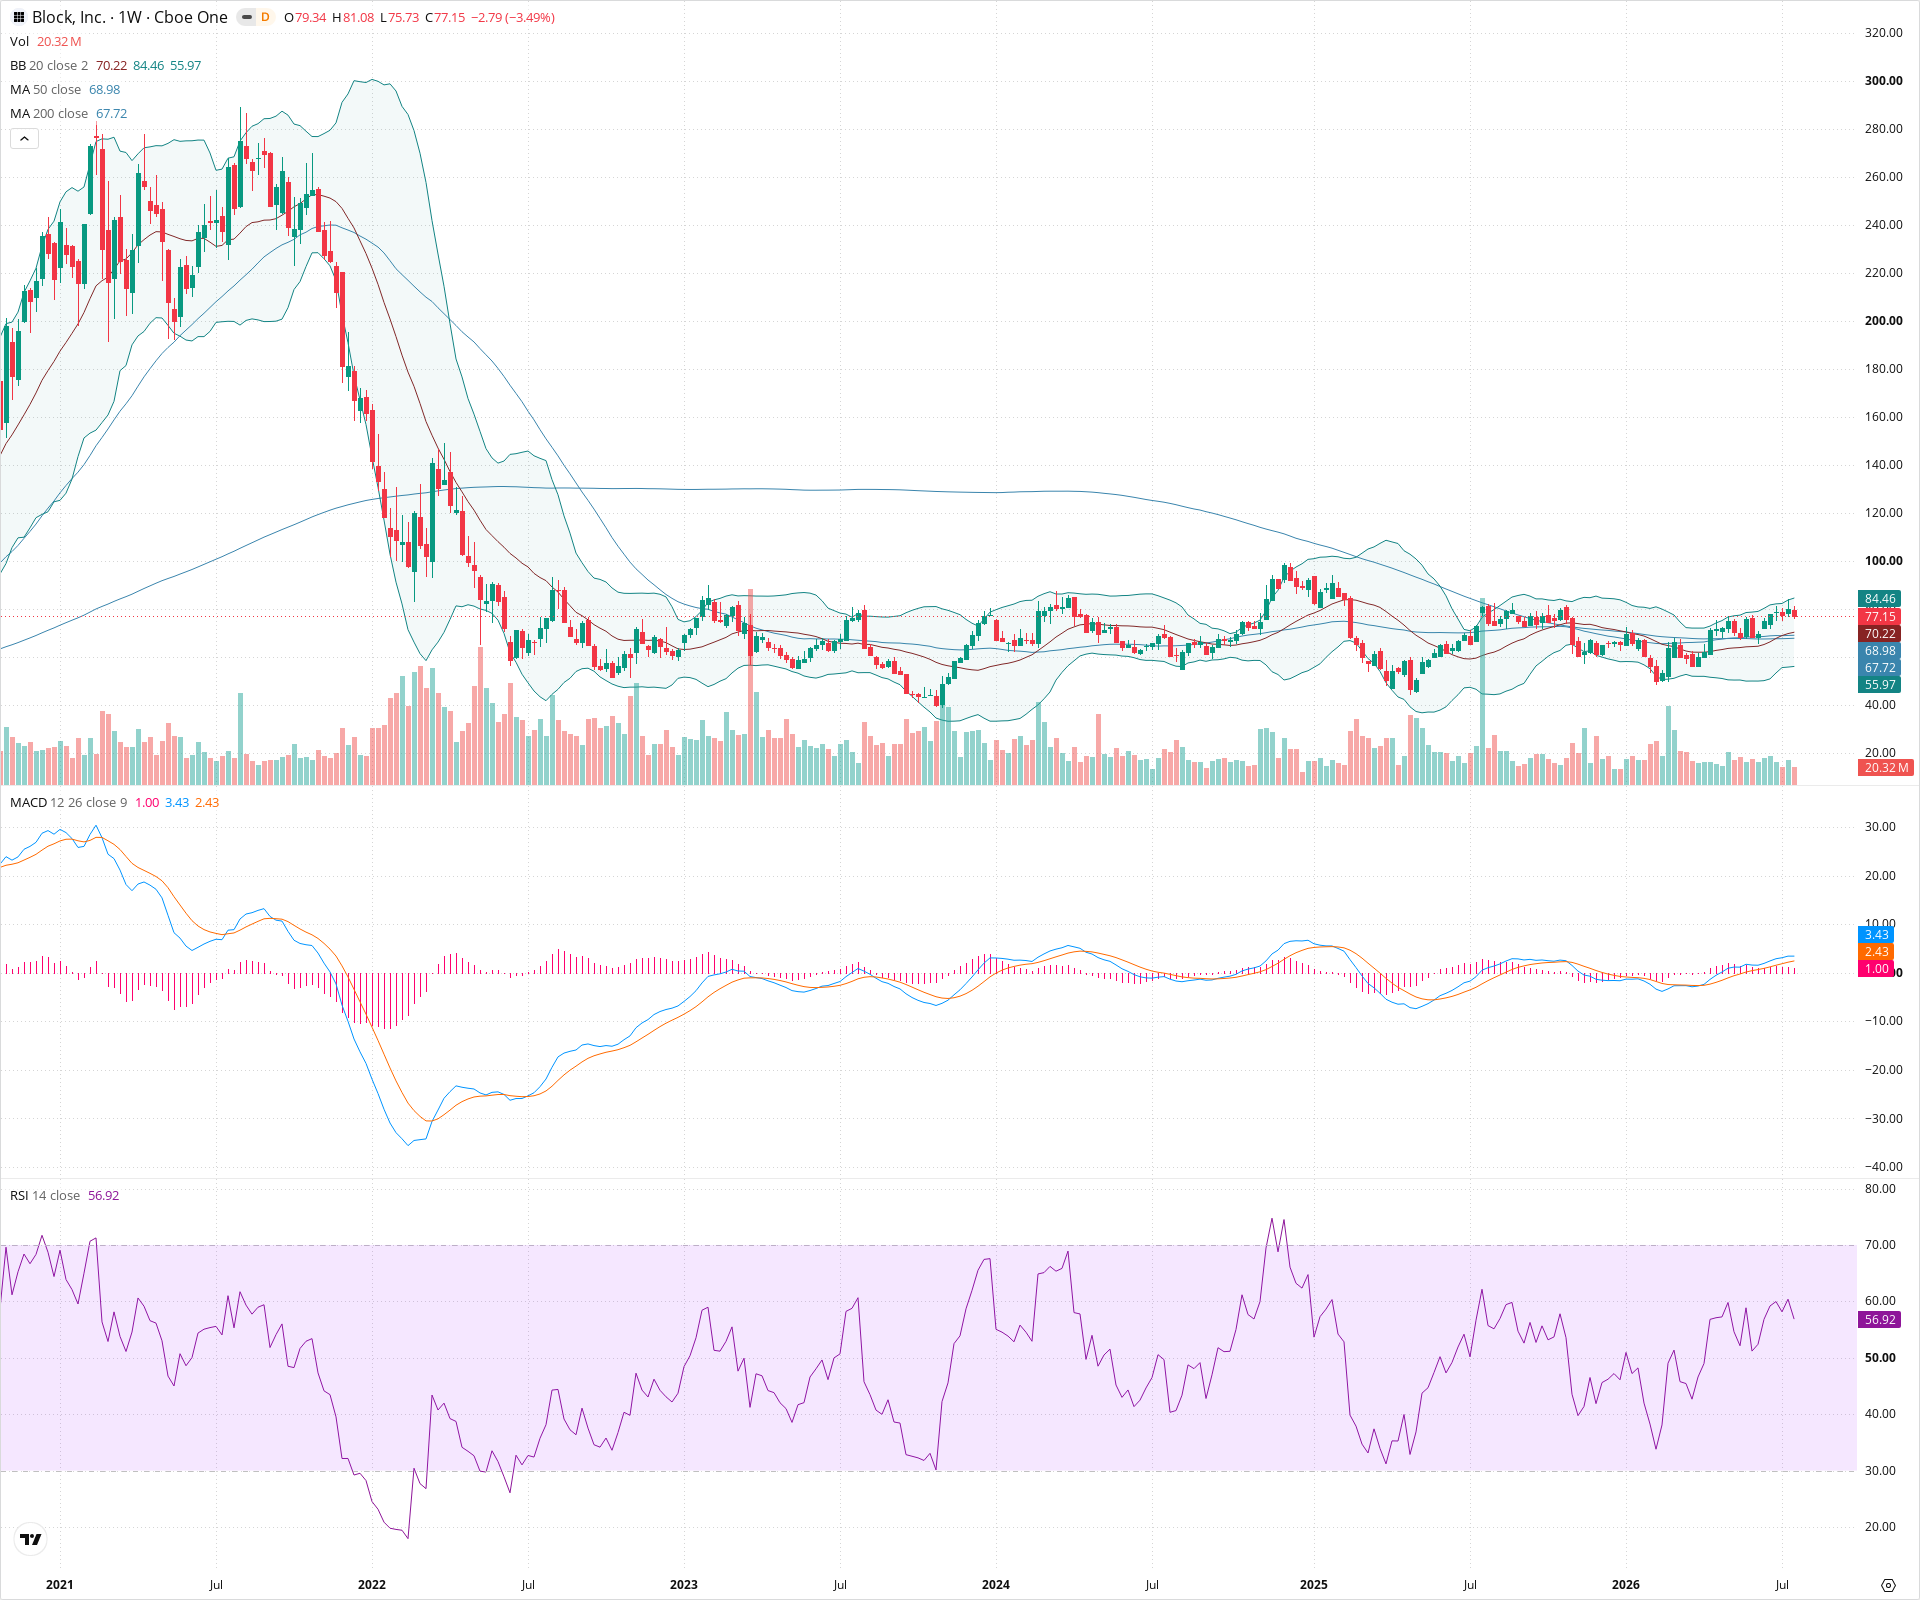
XYZ has spent over two years constructing a substantial base following a dramatic historical decline. The long-term technical picture is steadily improving, evidenced by the price holding above key weekly moving averages and transitioning into positive MACD territory. While the stock faces immediate resistance near 90 and is undergoing short-term consolidation, the overall structure points toward a potential macroeconomic trend reversal.
Included In Lists
Related Tickers of Interest
XYZ Weekly Chart
Sentiment
Short-term Sentiment (days to weeks): Neutral
Price is currently pulling back after failing to break resistance near 90. Momentum on the MACD histogram is waning, and RSI has dipped from recent highs, suggesting a period of consolidation, although price remains above key moving averages.
Long-term Sentiment (weeks to months): Bullish
The stock has formed a massive multi-year base, arresting a severe prior downtrend. Price has reclaimed both the 50-week and 200-week SMAs, and a long-term golden cross appears imminent, signaling a potential structural trend change.
Report Metadata
- Timeframe: weekly
- Generated at: 2026-07-25T09:09:55.701Z
- Model: gemini-3.1-pro-preview
Support Price Levels
| Level | Range | Strength | Notes |
|---|---|---|---|
| $67.50 | $65.00 - $70.00 | Strong | Major confluence zone consisting of the rising 50-week SMA, the flattening 200-week SMA, and a prior area of congestion. |
| $56.00 | $54.00 - $58.00 | Weak | Intermediate structural swing low from late 2023 and early 2024. |
| $42.50 | $40.00 - $45.00 | Strong | The absolute bottom of the multi-year base; major historical support. |
Resistance Price Levels
| Level | Range | Strength | Notes |
|---|---|---|---|
| $88.50 | $85.00 - $92.00 | Strong | Recent multi-month swing highs and the upper boundary of the long-term consolidation base. |
| $135.00 | $130.00 - $140.00 | Strong | Major historical breakdown level from mid-2022; significant overhead supply zone. |
Potential Chart Patterns in Formation
| Strength | Pattern | Signal | Target | Details |
|---|---|---|---|---|
| Strong | Long-term Base / Consolidation | Bullish | N/A | A massive sideways consolidation phase spanning roughly two years, bounded by 40 on the downside and 90 on the upside, absorbing overhead supply after a steep downtrend. |
Frequently Asked Questions about XYZ
What is the current sentiment for XYZ?
The short-term sentiment for XYZ is currently Neutral because Price is currently pulling back after failing to break resistance near 90. Momentum on the MACD histogram is waning, and RSI has dipped from recent highs, suggesting a period of consolidation, although price remains above key moving averages.. The long-term trend is classified as Bullish.
What are the key support levels for XYZ?
StockDips.AI has identified key support levels for XYZ at $67.50 and $56.00. These levels may represent potential accumulation zones where buying interest could emerge.
Is XYZ in a significant dip or a Value Dip right now?
XYZ has a Value Score of 26/100. It is not currently flagged as a significant dip in the Top Dips list. It is not listed as a Value Dip because the long-term sentiment or value-score threshold does not qualify.
View the full interactive analysis on StockDips.AI.