AAOI Weekly Technical Analysis
Applied Optoelectronics, Inc
Applied Optoelectronics, Inc. (AAOI) designs and manufactures advanced fiber-optic networking products, specifically high-speed optical transceivers and laser components that convert electrical signals into light to move massive volumes of data inside internet data centers, cloud networks, and cable television systems.
AAOI Technical Analysis Summary
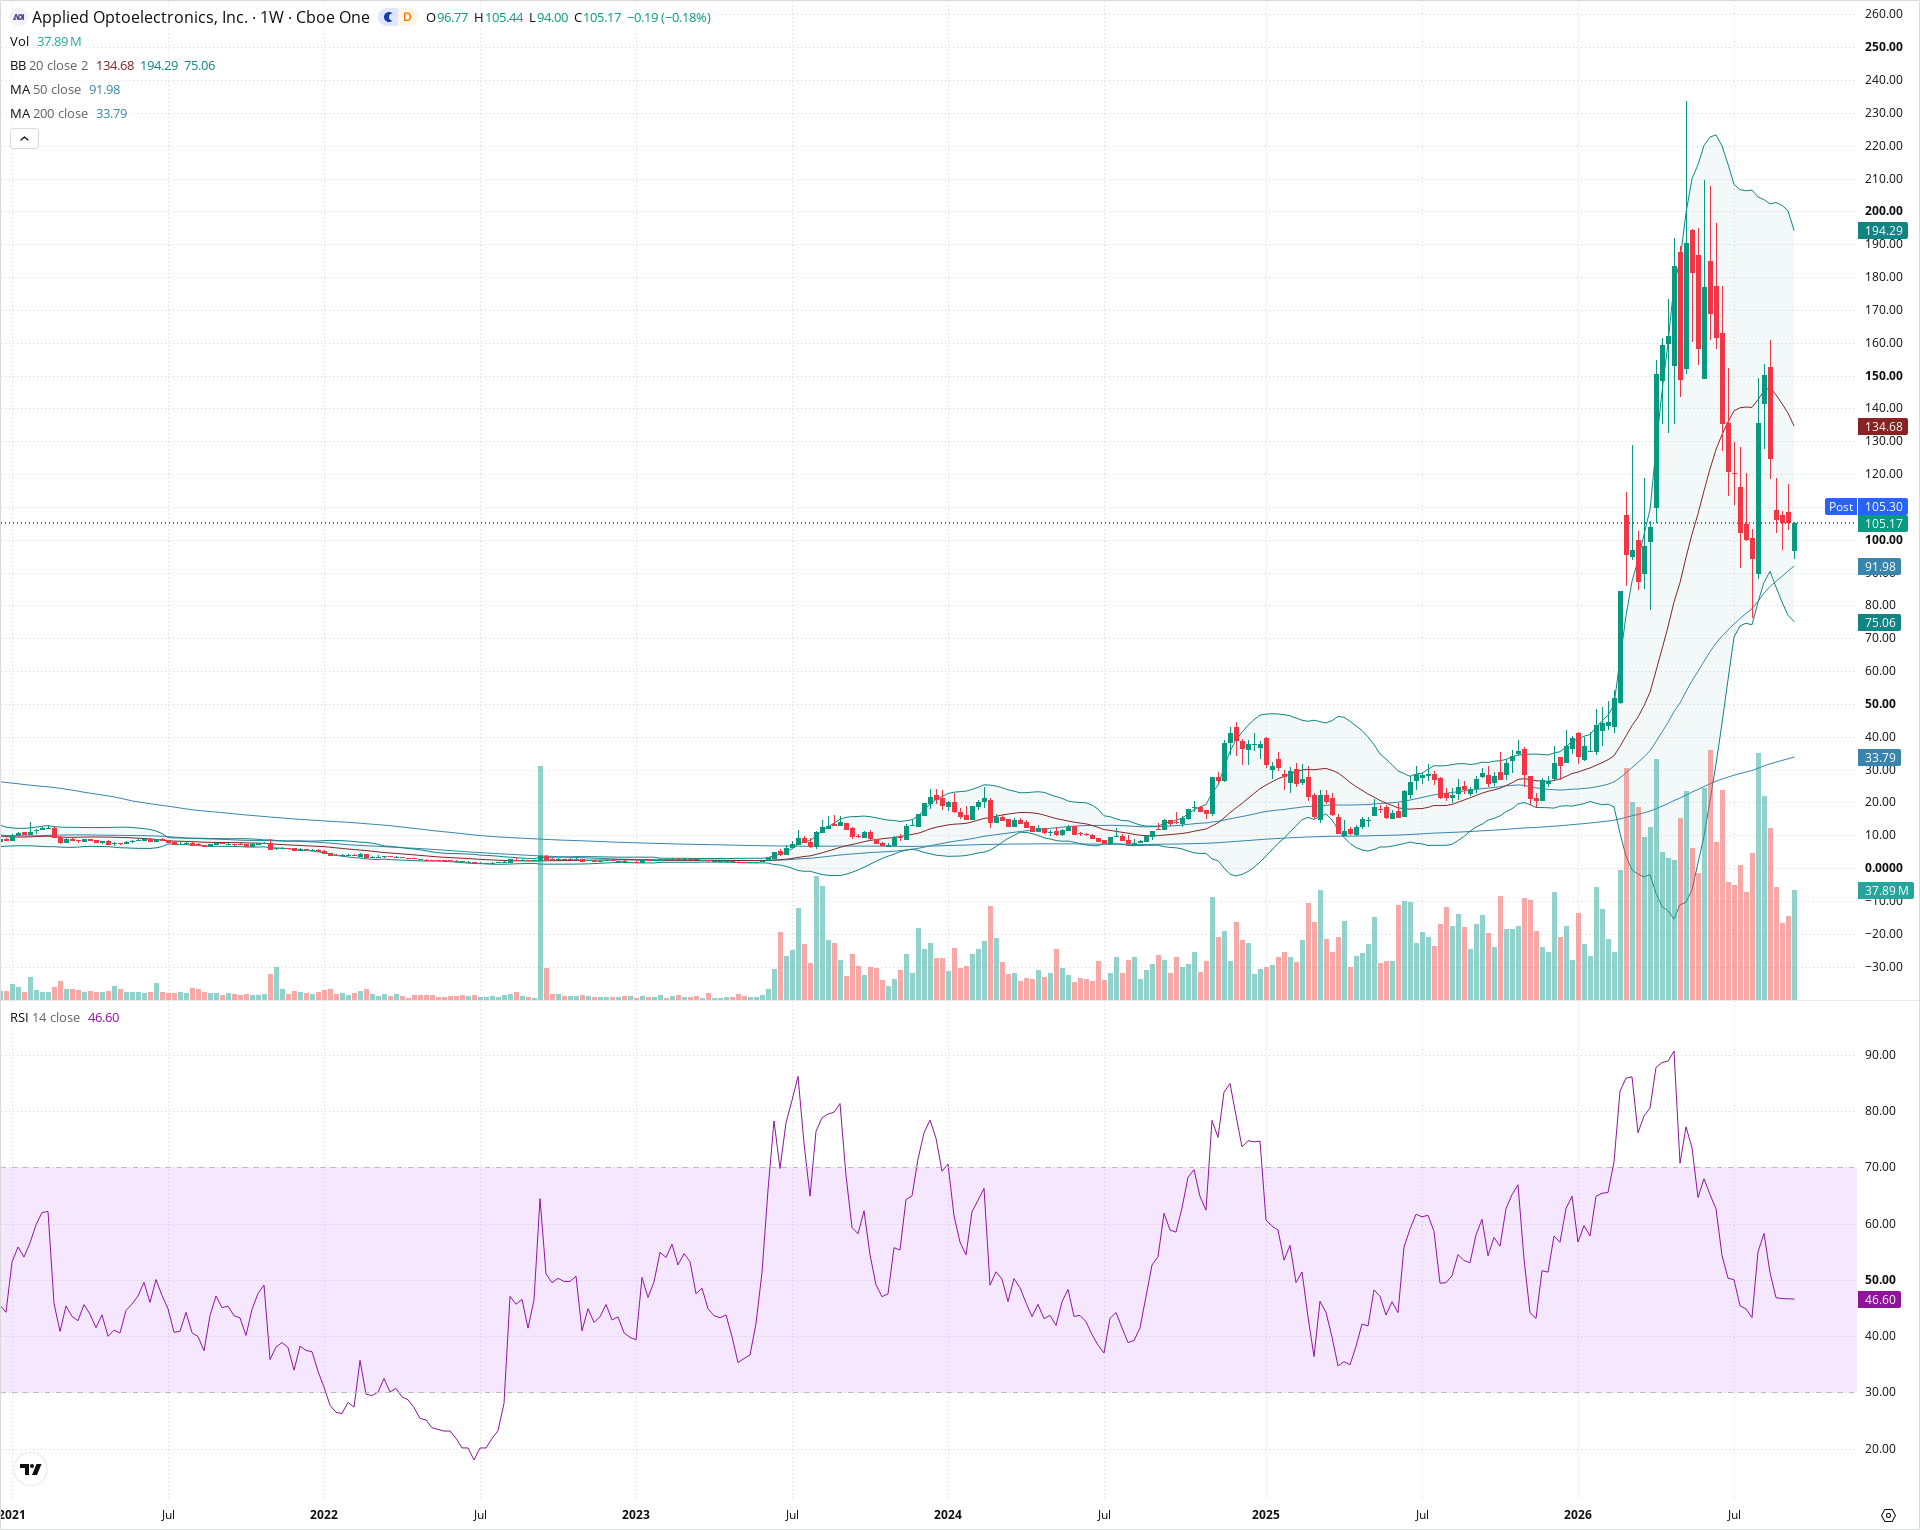
AAOI is in a consolidation and recovery phase following a severe retracement from its cyclical highs near $240. The stock has found firm buying interest at the rising 50-week SMA near $92, forming a potential short-term double bottom. While the long-term trend remains upward due to positive 50/200-week moving average alignment, overhead supply and the descending 20-week SMA near $134.68 serve as the primary hurdle for any sustained bullish continuation.
Included In Lists
Related Tickers of Interest
AAOI Weekly Chart
Sentiment
Short-term Sentiment (days to weeks): Neutral
Price is attempting to stabilize and bounce off the rising 50-week SMA (~92) after a steep multi-month correction, though it remains below the declining 20-week SMA (134.68) with RSI below 50.
Long-term Sentiment (weeks to months): Bullish
The broader weekly trend remains structurally positive with the 50-week SMA trending well above the rising 200-week SMA (33.79), reflecting significant multi-year expansion from prior base levels.
Report Metadata
- Timeframe: weekly
- Generated at: 2026-09-18T21:07:25.748Z
- Model: gemini-3.8-flash
Support Price Levels
| Level | Range | Strength | Notes |
|---|---|---|---|
| $92.50 | $90.00 - $95.00 | Strong | Confluence of recent multi-week swing lows and the rising 50-week simple moving average. |
| $74.00 | $72.00 - $76.00 | Moderate | Aligns with the lower Bollinger Band and the late 2025 breakout acceleration zone. |
Resistance Price Levels
| Level | Range | Strength | Notes |
|---|---|---|---|
| $134.00 | $130.00 - $138.00 | Strong | Cluster defined by the 20-week SMA (middle Bollinger Band at 134.68) and prior breakdown shelf. |
| $170.00 | $165.00 - $175.00 | Moderate | Previous lower peak established during the post-peak corrective structure. |
Potential Chart Patterns in Formation
| Strength | Pattern | Signal | Target | Details |
|---|---|---|---|---|
| Moderate | Double Bottom | Bullish | $134.00 | Price formed two distinct weekly retests around the $90–$94 level, holding above key moving average support. |
Frequently Asked Questions about AAOI
What is the current sentiment for AAOI?
The short-term sentiment for AAOI is currently Neutral because Price is attempting to stabilize and bounce off the rising 50-week SMA (~92) after a steep multi-month correction, though it remains below the declining 20-week SMA (134.68) with RSI below 50.. The long-term trend is classified as Bullish.
What are the key support levels for AAOI?
StockDips.AI has identified key support levels for AAOI at $92.50 and $74.00. These levels may represent potential accumulation zones where buying interest could emerge.
Is AAOI in a significant dip or a Value Dip right now?
AAOI has a Value Score of 47/100. It is not currently flagged as a significant dip in the Top Dips list. It is not listed as a Value Dip because the long-term sentiment or value-score threshold does not qualify.
View the full interactive analysis on StockDips.AI.