HPE Daily Technical Analysis
Hewlett Packard Enterprise
Provides enterprise technology solutions including cloud services, data center servers, storage, and networking hardware.
HPE Technical Analysis Summary
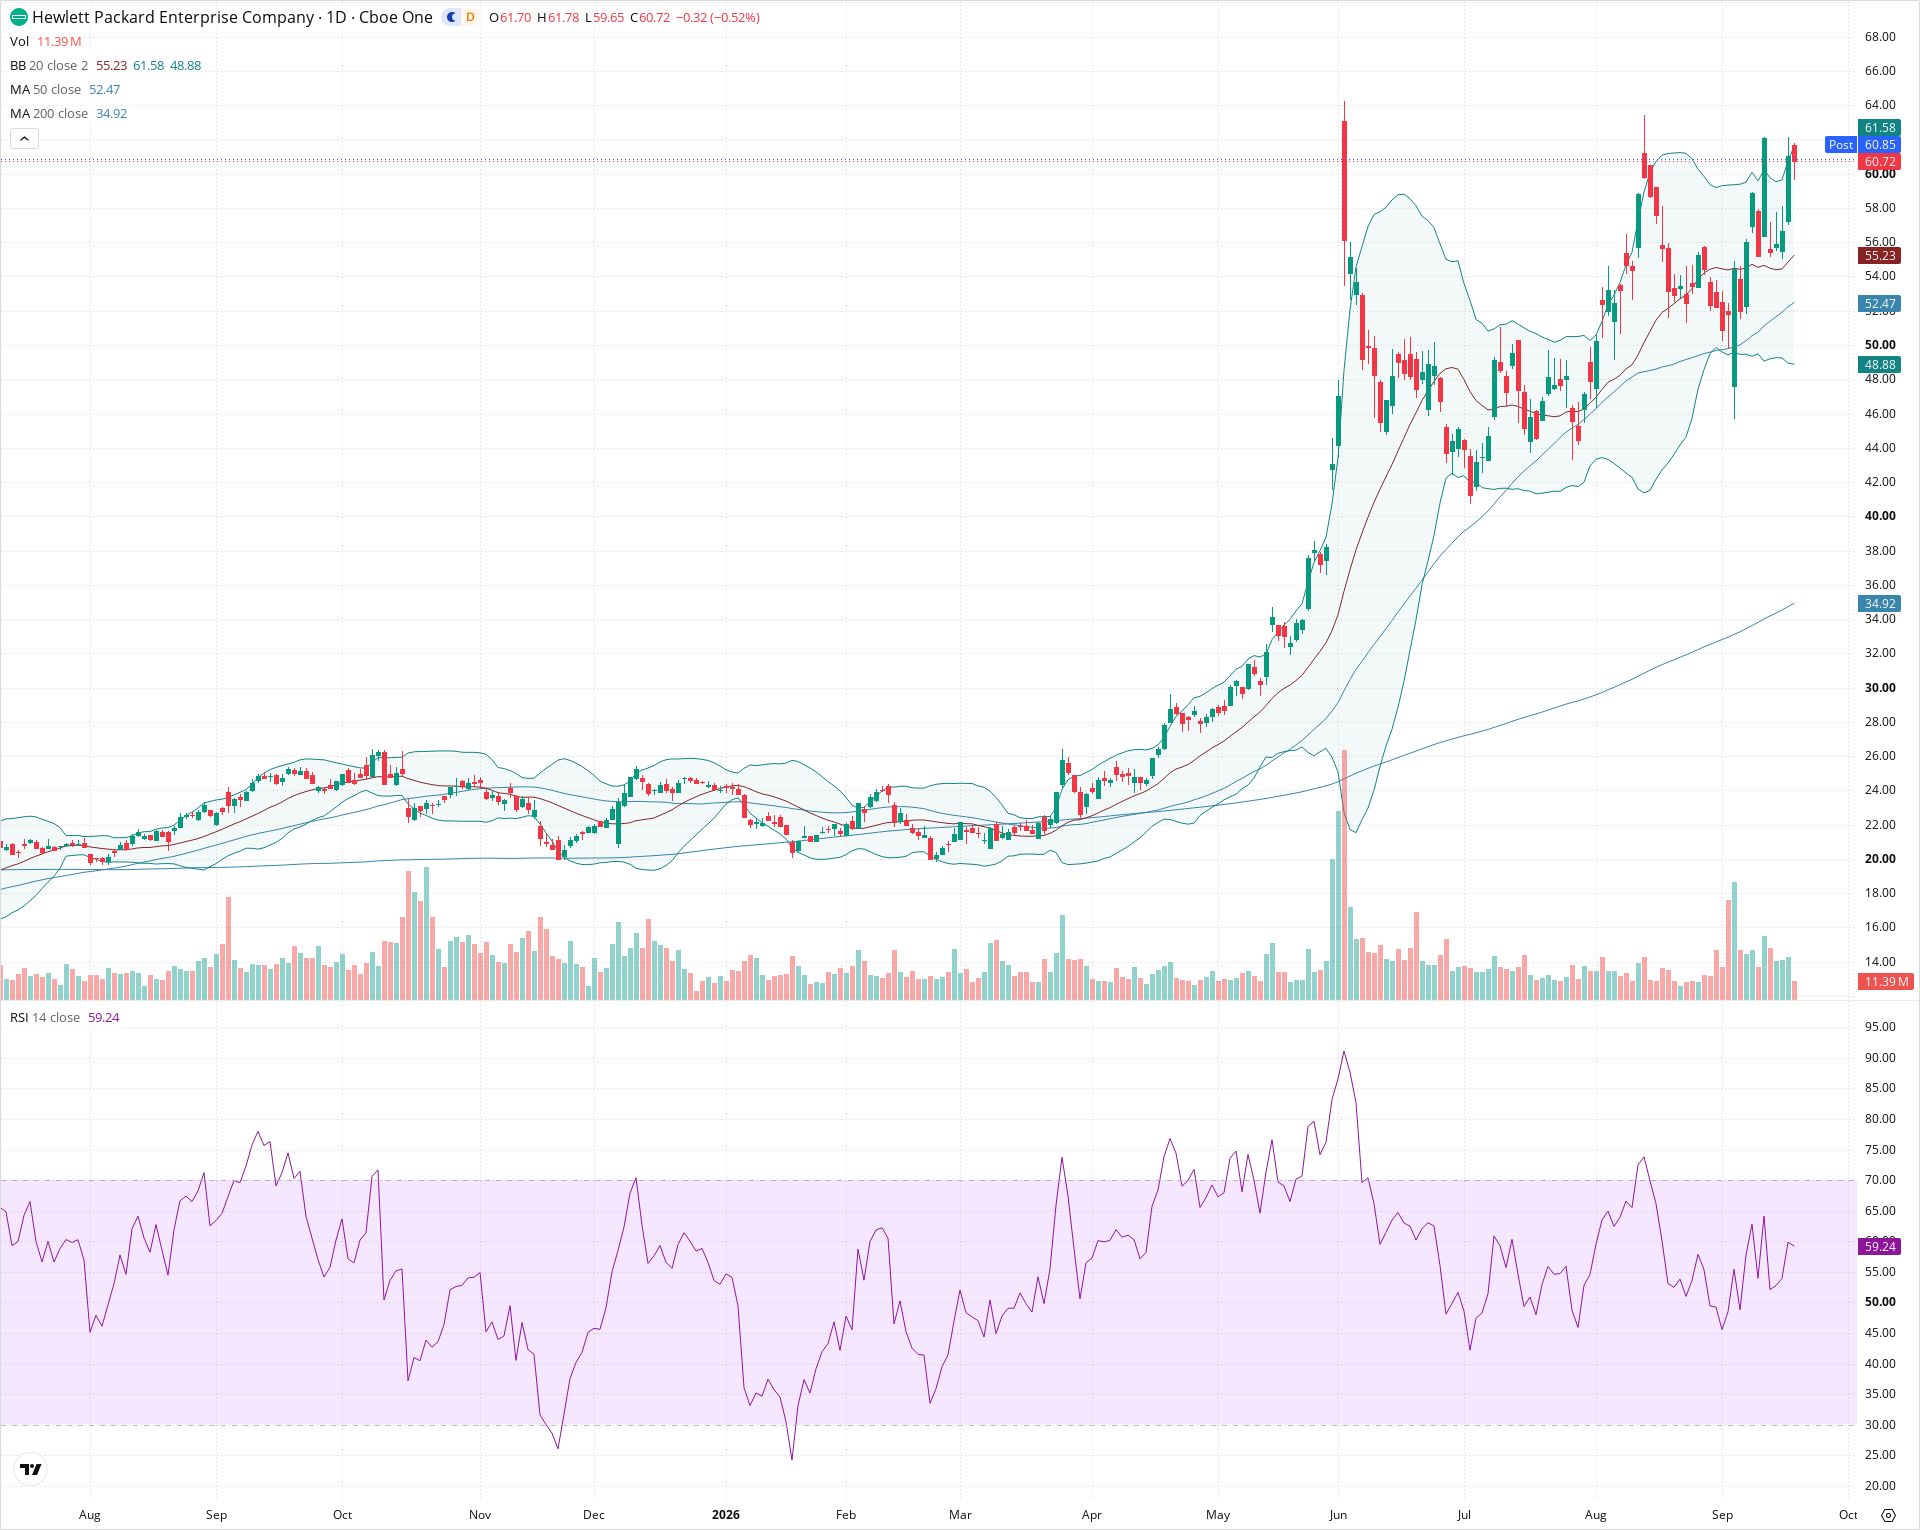
Hewlett Packard Enterprise continues to trade in a strong broader bull market, well supported by its rising 50-day and 200-day moving averages. Near-term price action is challenging critical overhead resistance in the 61.50–63.00 region. A confirmed breakout above this zone would clear the path toward June highs near 65.00, whereas failure to break through could see a healthy retracement back toward the 20-day SMA around 55.23.
Included In Lists
Related Tickers of Interest
HPE Daily Chart
Sentiment
Short-term Sentiment (days to weeks): Bullish
Price remains in an active short-term uptrend above the upward-sloping 20-day SMA (55.23) and upper half of the Bollinger Bands, despite a mild pullback from the 62.00 level.
Long-term Sentiment (weeks to months): Bullish
Clear long-term uptrend characterized by a strong golden cross alignment, with the 50-day SMA (52.47) ascending steeply far above the 200-day SMA (34.92).
Report Metadata
- Timeframe: daily
- Generated at: 2026-09-18T20:21:13.759Z
- Model: gemini-3.8-flash
Support Price Levels
| Level | Range | Strength | Notes |
|---|---|---|---|
| $55.00 | $54.50 - $55.50 | Moderate | Confluence of the rising 20-day SMA and prior interim consolidation resistance turned support. |
| $50.25 | $48.00 - $52.50 | Strong | Key support zone defined by the 50-day SMA and the late August swing lows. |
Resistance Price Levels
| Level | Range | Strength | Notes |
|---|---|---|---|
| $62.25 | $61.50 - $63.00 | Moderate | Upper Bollinger Band boundary and late August swing high resistance area. |
| $64.75 | $64.00 - $65.50 | Strong | Major high-water mark set by the early June spike wick. |
Potential Chart Patterns in Formation
| Strength | Pattern | Signal | Target | Details |
|---|---|---|---|---|
| Moderate | Double Top Test | Neutral | N/A | Price has rebounded to retest the late August peak near 62.00-63.00, showing initial signs of upper-wick resistance. |
Frequently Asked Questions about HPE
What is the current sentiment for HPE?
The short-term sentiment for HPE is currently Bullish because Price remains in an active short-term uptrend above the upward-sloping 20-day SMA (55.23) and upper half of the Bollinger Bands, despite a mild pullback from the 62.00 level.. The long-term trend is classified as Bullish.
What are the key support levels for HPE?
StockDips.AI has identified key support levels for HPE at $55.00 and $50.25. These levels may represent potential accumulation zones where buying interest could emerge.
Is HPE in a significant dip or a Value Dip right now?
HPE has a Value Score of 21/100. It is not currently flagged as a significant dip in the Top Dips list. It is not listed as a Value Dip because the long-term sentiment or value-score threshold does not qualify.
View the full interactive analysis on StockDips.AI.