ADBE Daily Technical Analysis
Adobe Inc.
Developer of creative and digital media software including Photoshop, Illustrator, Premiere, and Acrobat. A leader in cloud-based creative software and digital marketing platforms.
ADBE Technical Analysis Summary
ADBE remains in a long-term bearish trend, dominated by a declining 200-day SMA. However, short-term momentum is shifting bullishly as the stock forms a potential double bottom base off the 150-160 zone. Investors should watch for a sustained break above the 50-day SMA and the 240 resistance level to confirm a structural trend change, backed by improving MACD momentum.
Included In Lists
Related Tickers of Interest
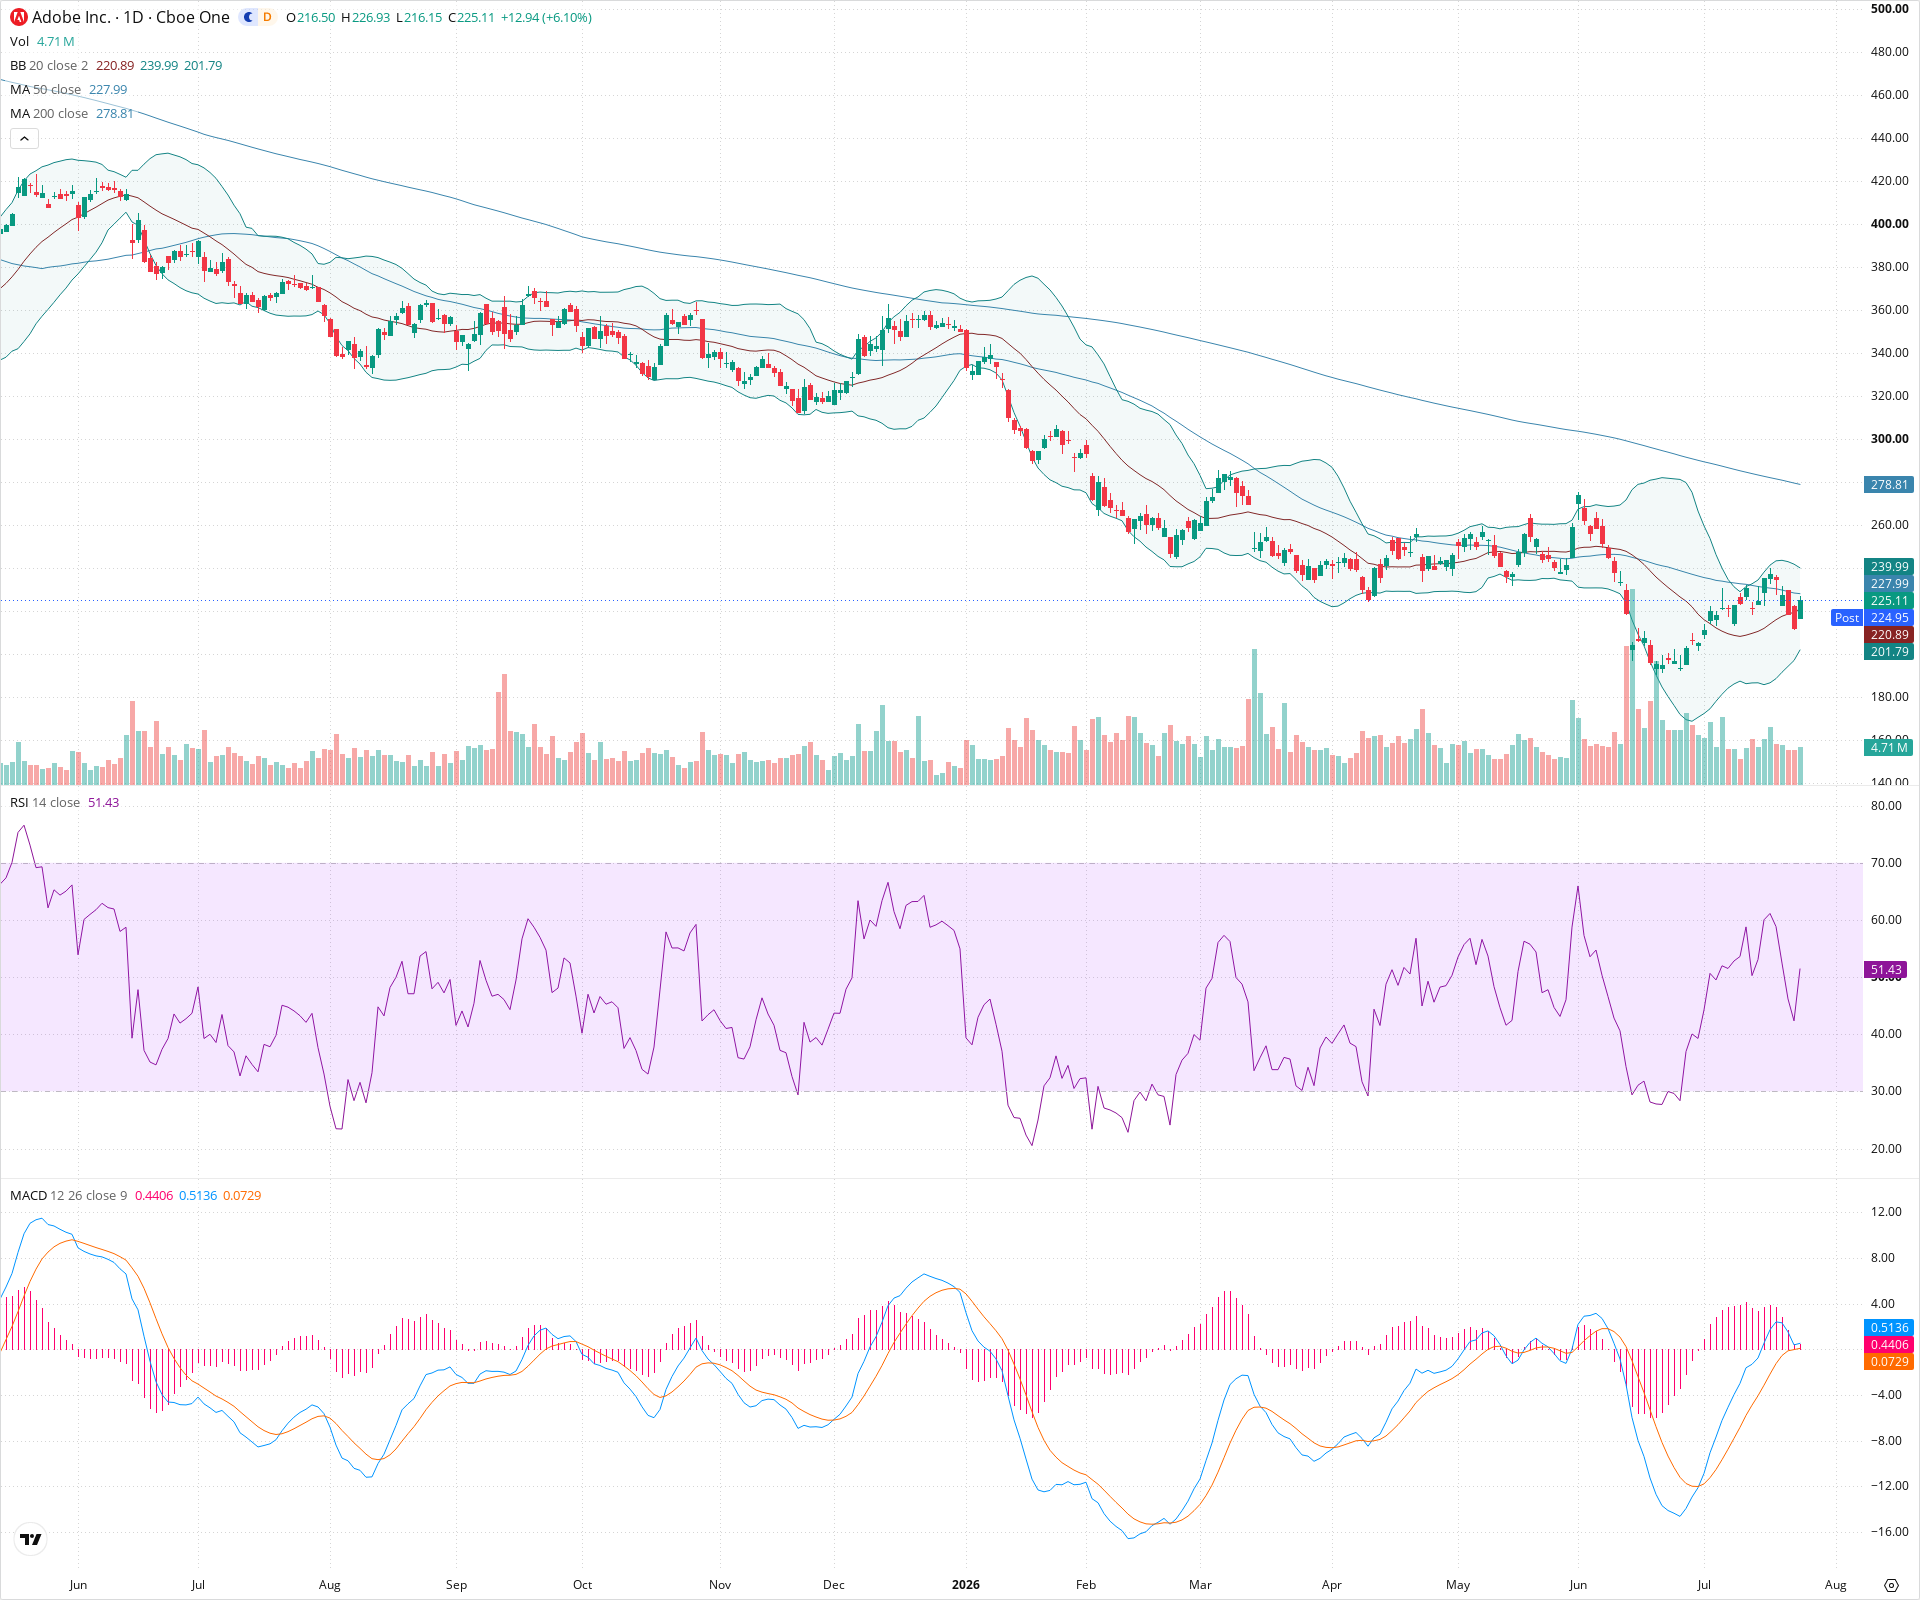
ADBE Daily Chart
Sentiment
Short-term Sentiment (days to weeks): Bullish
Price has formed a higher low and is rallying with increased volume. MACD has crossed bullishly and is rising above the zero line, while RSI is trending upward toward the midrange. The price is currently challenging the 50-day SMA.
Long-term Sentiment (weeks to months): Bearish
The broader trend remains clearly downward, with the price trading significantly below a declining 200-day SMA. A structural reversal requires breaking major previous lower highs.
Report Metadata
- Timeframe: daily
- Generated at: 2026-07-24T21:12:05.801Z
- Model: gemini-3.1-pro-preview
Support Price Levels
| Level | Range | Strength | Notes |
|---|---|---|---|
| $205.00 | $200.00 - $210.00 | Weak | Recent swing low established before the current upward leg. |
| $155.00 | $150.00 - $160.00 | Strong | Major structural swing low and multi-month support base. |
Resistance Price Levels
| Level | Range | Strength | Notes |
|---|---|---|---|
| $240.00 | $235.00 - $245.00 | Strong | Recent swing high, acting as immediate overhead resistance and aligning with the upper Bollinger Band. |
| $280.00 | $275.00 - $285.00 | Strong | Major resistance zone defined by the declining 200-day SMA and a previous consolidation area. |
Potential Chart Patterns in Formation
| Strength | Pattern | Signal | Target | Details |
|---|---|---|---|---|
| Weak | Potential Double Bottom | Bullish | N/A | Price found a low around 150-160 in May, rallied, and tested the 160 area again in July before bouncing. The pattern is forming but needs a decisive break above the 235-245 neckline to confirm. |
Frequently Asked Questions about ADBE
What is the current sentiment for ADBE?
The short-term sentiment for ADBE is currently Bullish because Price has formed a higher low and is rallying with increased volume. MACD has crossed bullishly and is rising above the zero line, while RSI is trending upward toward the midrange. The price is currently challenging the 50-day SMA.. The long-term trend is classified as Bearish.
What are the key support levels for ADBE?
StockDips.AI has identified key support levels for ADBE at $205.00 and $155.00. These levels may represent potential accumulation zones where buying interest could emerge.
Is ADBE in a significant dip or a Value Dip right now?
ADBE has a Value Score of 43/100. It is not currently flagged as a significant dip in the Top Dips list. It is not listed as a Value Dip because the long-term sentiment or value-score threshold does not qualify.
View the full interactive analysis on StockDips.AI.