ASTS Weekly Technical Analysis
AST SpaceMobile, Inc
Aerospace and satellite communications company that is building the first and only space-based cellular broadband network designed to connect directly with standard, unmodified mobile phones. The company's mission is to eliminate connectivity gaps globally by providing 4G and 5G coverage in remote and underserved regions where traditional ground infrastructure is unavailable.
ASTS Technical Analysis Summary
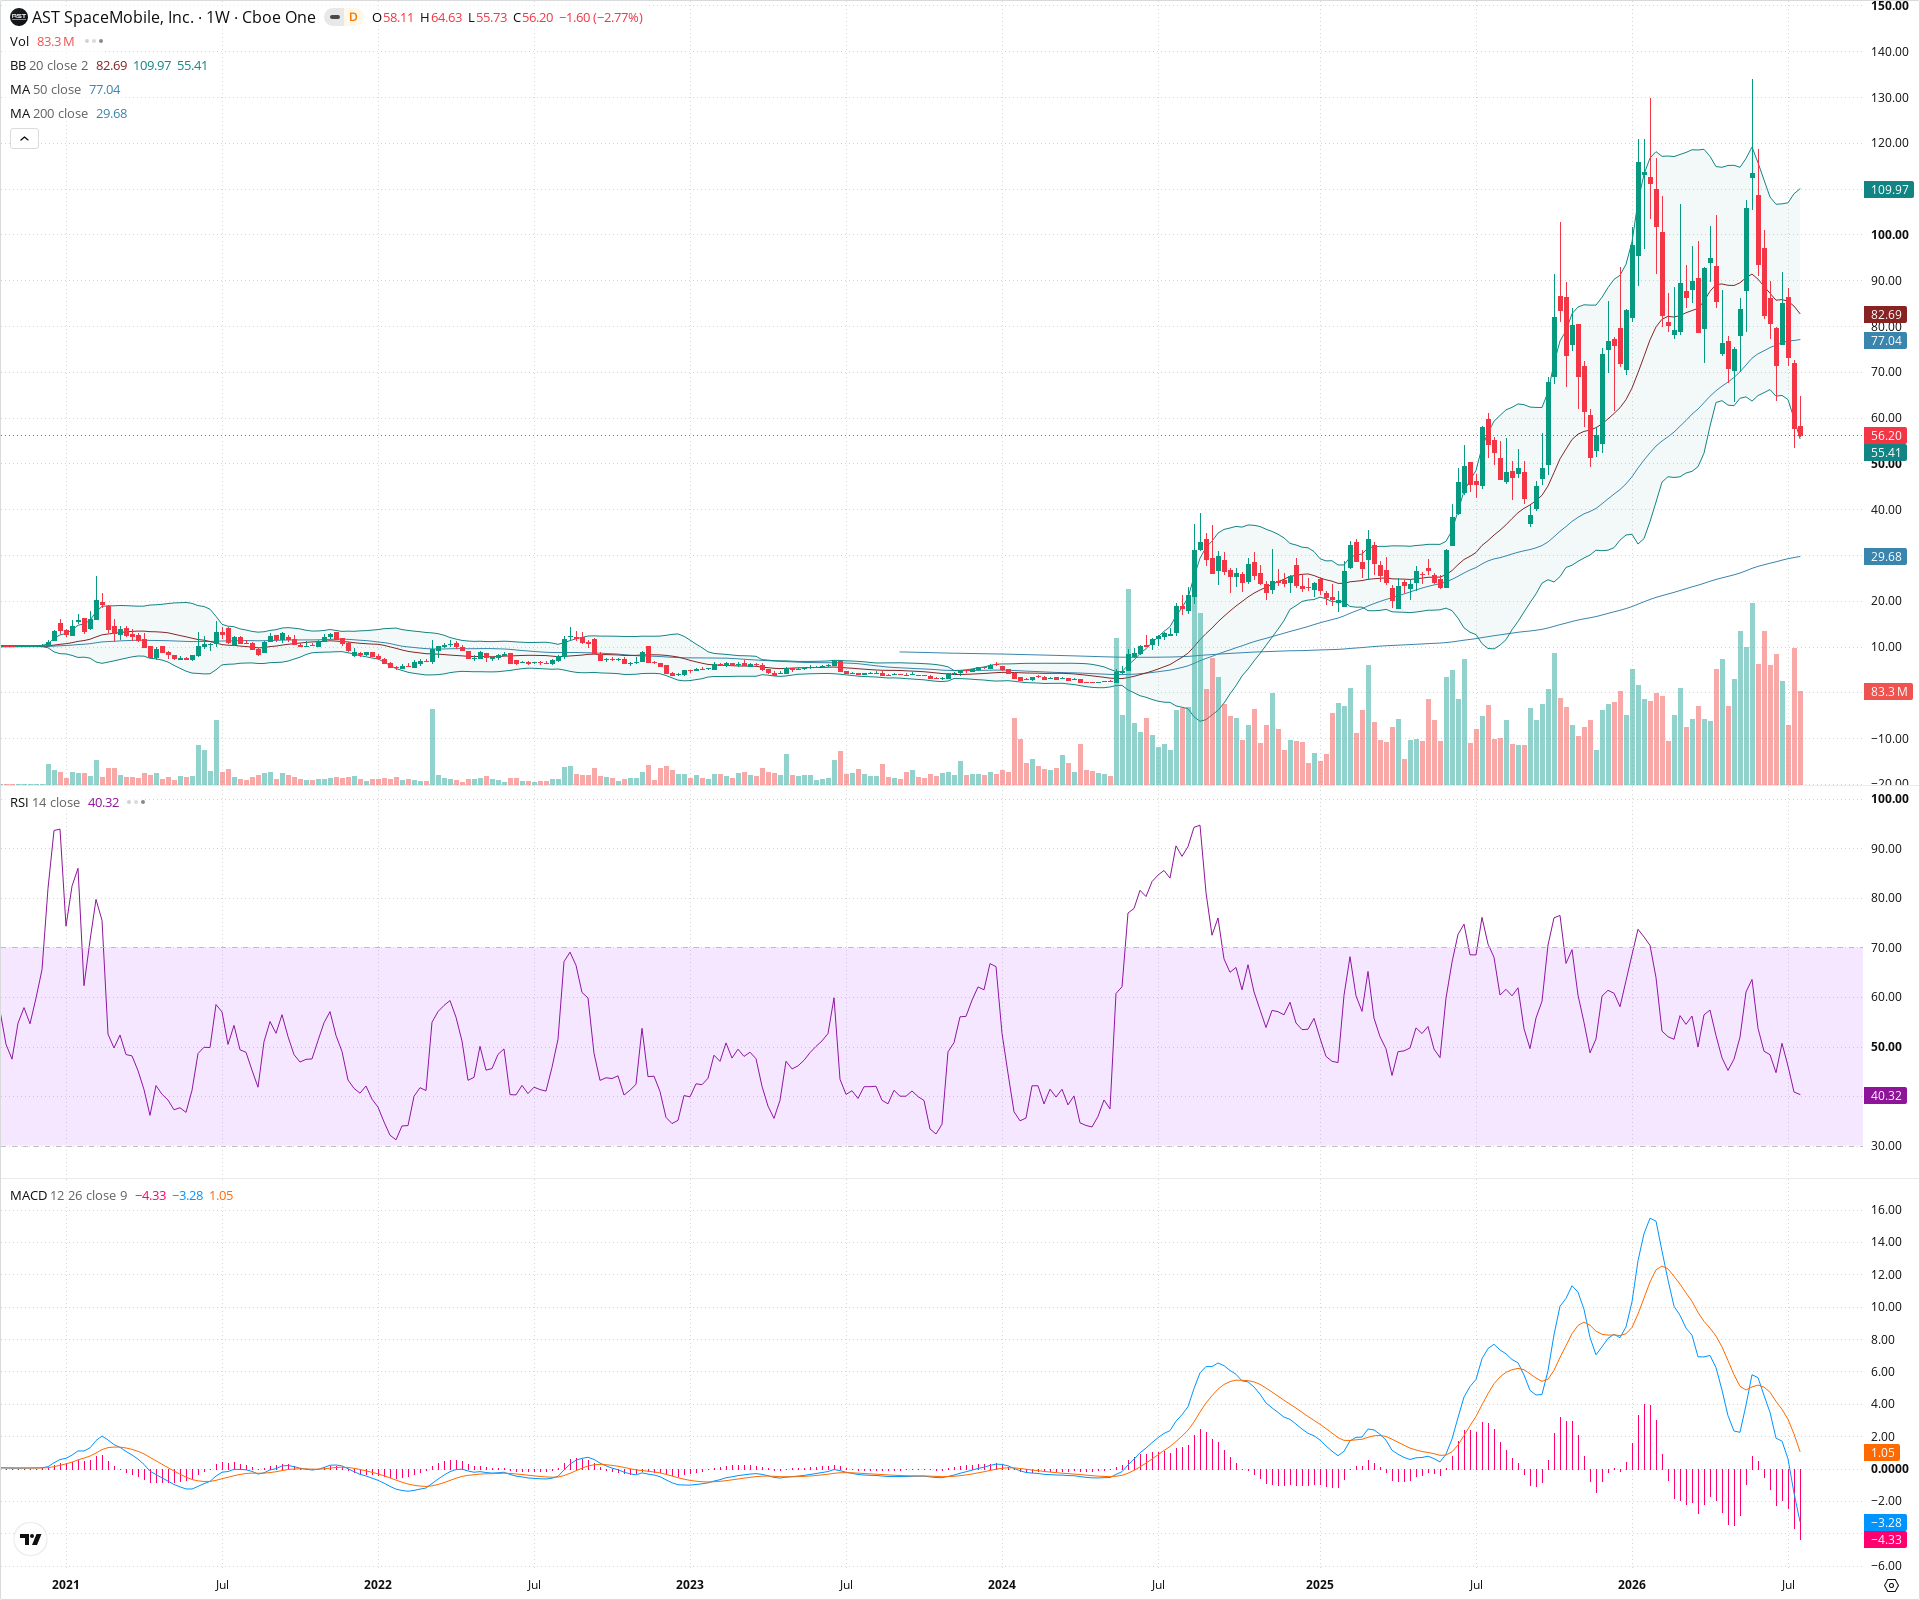
The weekly chart depicts a severe trend reversal following a historical parabolic rally. A massive head and shoulders topping structure has broken down decisively, sending price plunging through the 20 and 50-week moving averages. With momentum indicators deeply bearish, further downside towards the 200-week SMA in the 25-30 zone appears probable as the asset undergoes a deep macroeconomic correction.
Included In Lists
Related Tickers of Interest
ASTS Weekly Chart
Sentiment
Short-term Sentiment (days to weeks): Bearish
Price is in a steep, aggressive downtrend with consecutive large red weekly candles, having broken decisively below both the 20-week and 50-week SMAs. MACD histogram is negative and expanding downwards.
Long-term Sentiment (weeks to months): Bearish
A massive multi-month topping structure has broken down, invalidating the previous parabolic uptrend. While the 200-week SMA is still rising, the severity of the breakdown suggests a prolonged corrective or basing phase is required.
Report Metadata
- Timeframe: weekly
- Generated at: 2026-07-25T09:08:06.898Z
- Model: gemini-3.1-pro-preview
Support Price Levels
| Level | Range | Strength | Notes |
|---|---|---|---|
| $28.50 | $25.00 - $32.00 | Strong | Confluence of a major prior structural swing low and the rising 200-week SMA. |
| $12.50 | $10.00 - $15.00 | Strong | Historical long-term base accumulation zone prior to the massive breakout. |
Resistance Price Levels
| Level | Range | Strength | Notes |
|---|---|---|---|
| $79.00 | $75.00 - $83.00 | Strong | Previous major support zone (neckline of topping pattern) turned resistance, now confluent with the 50-week and 20-week SMAs. |
| $115.00 | $110.00 - $120.00 | Strong | Major structural lower high that formed the right shoulder of the topping pattern. |
Potential Chart Patterns in Formation
| Strength | Pattern | Signal | Target | Details |
|---|---|---|---|---|
| Strong | Head and Shoulders Top Breakdown | Bearish | $30.00 | A massive multi-month topping pattern with peaks roughly at 120 (left shoulder), 140 (head), and 115 (right shoulder). Price has aggressively broken down below the neckline support area of 75-80 on high volume, triggering the pattern. |
Frequently Asked Questions about ASTS
What is the current sentiment for ASTS?
The short-term sentiment for ASTS is currently Bearish because Price is in a steep, aggressive downtrend with consecutive large red weekly candles, having broken decisively below both the 20-week and 50-week SMAs. MACD histogram is negative and expanding downwards.. The long-term trend is classified as Bearish.
What are the key support levels for ASTS?
StockDips.AI has identified key support levels for ASTS at $28.50 and $12.50. These levels may represent potential accumulation zones where buying interest could emerge.
Is ASTS in a significant dip or a Value Dip right now?
ASTS has a Value Score of 95/100. It is currently flagged as a significant dip in the Top Dips list. It is not listed as a Value Dip because the long-term sentiment or value-score threshold does not qualify.
View the full interactive analysis on StockDips.AI.