BHVN Daily Technical Analysis
Biohaven Ltd
Biopharmaceutical company focused on discovering, developing, and commercializing treatments for diseases in neuroscience, immunology, and oncology
BHVN Technical Analysis Summary
Following a catastrophic drop late last year, BHVN has spent recent months grinding out a base and establishing a new medium-term uptrend, bringing the price back above key long-term moving averages. Currently, the stock is experiencing a healthy short-term retracement after hitting resistance near $17, confirmed by cooling momentum indicators. For long-term investors, the primary focus will be on whether the stock can find support at the rising 50-day SMA to keep the broader recovery structure intact.
Included In Lists
Related Tickers of Interest
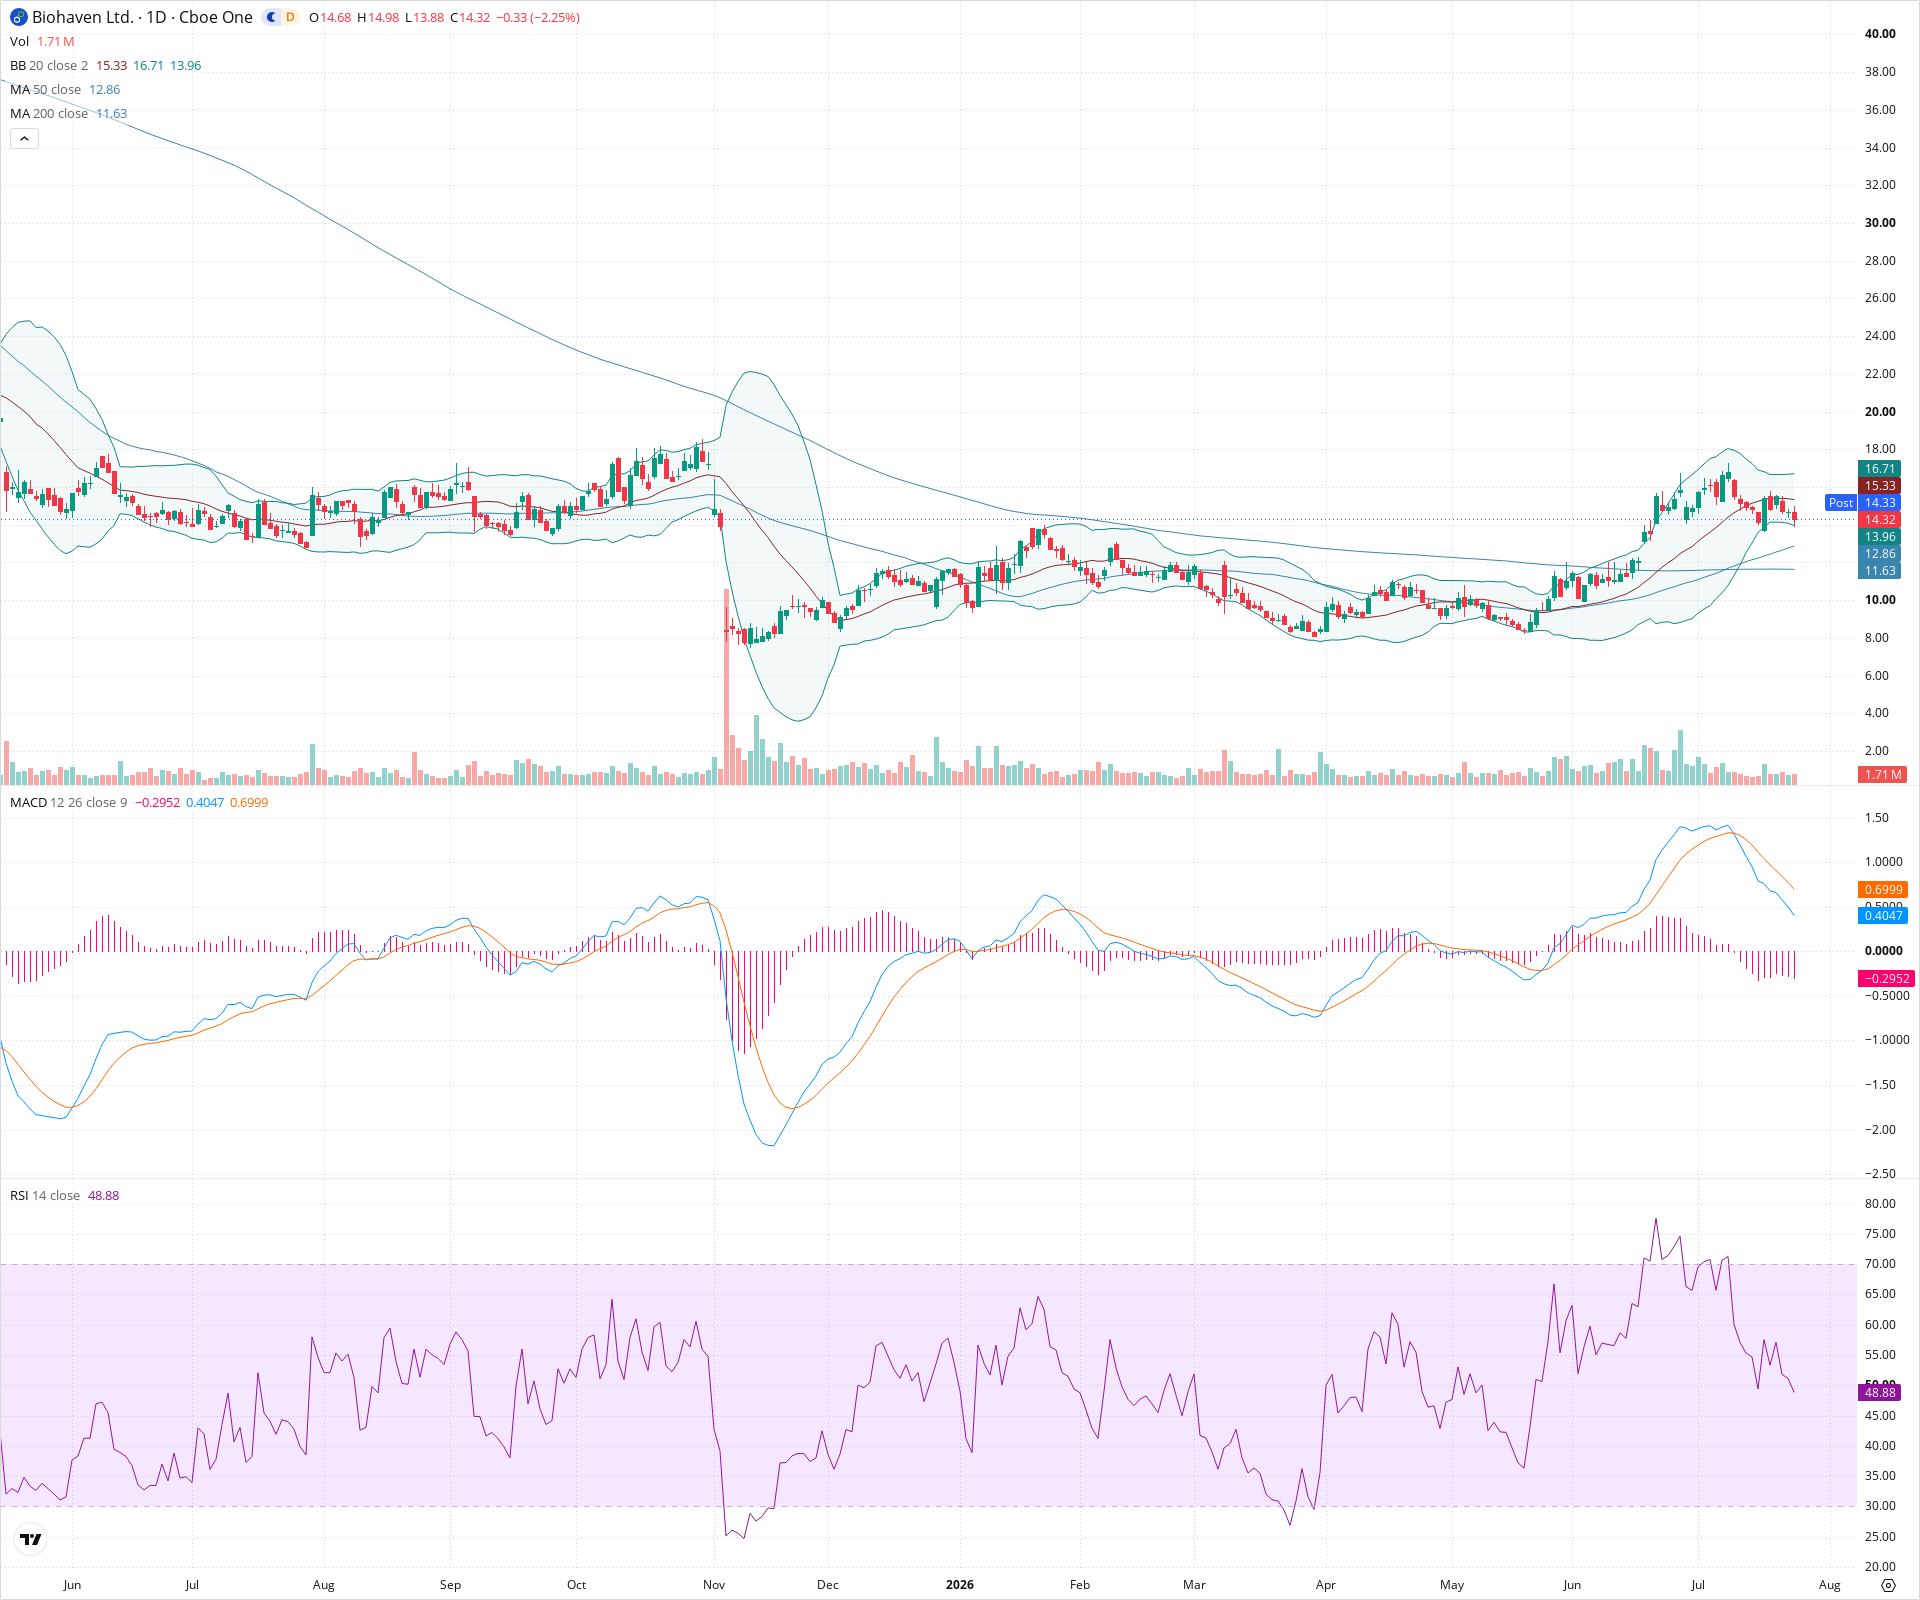
BHVN Daily Chart
Sentiment
Short-term Sentiment (days to weeks): Bearish
Price has recently been rejected at the upper Bollinger Band and has fallen below the 20-day SMA. Momentum indicators support this pullback, with the MACD line crossing below the signal line, negative histogram expansion, and RSI declining towards the neutral 50 level.
Long-term Sentiment (weeks to months): Bullish
Despite the massive historical gap down, the stock has established a medium-term recovery trend characterized by higher highs and higher lows. The price is currently sustaining above both the rising 50-day SMA and the flattening 200-day SMA, indicating underlying structural strength.
Report Metadata
- Timeframe: daily
- Generated at: 2026-07-24T21:16:13.620Z
- Model: gemini-3.1-pro-preview
Support Price Levels
| Level | Range | Strength | Notes |
|---|---|---|---|
| $13.95 | $13.80 - $14.10 | Weak | Immediate support zone near the lower Bollinger Band and minor previous consolidation levels. |
| $12.85 | $12.60 - $13.10 | Strong | Key support zone aligning with the rising 50-day SMA and structural support from the May/June consolidation phase before the recent leg up. |
| $11.65 | $11.50 - $11.80 | Strong | Major structural support aligning with the 200-day SMA. |
Resistance Price Levels
| Level | Range | Strength | Notes |
|---|---|---|---|
| $15.35 | $15.20 - $15.50 | Moderate | Immediate dynamic resistance at the 20-day SMA (middle Bollinger Band). |
| $16.85 | $16.50 - $17.20 | Strong | Recent swing highs and the area of the upper Bollinger Band where price was recently rejected. |
Potential Chart Patterns in Formation
| Strength | Pattern | Signal | Target | Details |
|---|---|---|---|---|
| Moderate | Retracement | Bearish | $13.00 | The stock is undergoing a standard technical pullback after a strong impulse wave from $9 to $17. It is currently digesting those gains, with short-term momentum turning negative as it searches for higher support. |
Frequently Asked Questions about BHVN
What is the current sentiment for BHVN?
The short-term sentiment for BHVN is currently Bearish because Price has recently been rejected at the upper Bollinger Band and has fallen below the 20-day SMA. Momentum indicators support this pullback, with the MACD line crossing below the signal line, negative histogram expansion, and RSI declining towards the neutral 50 level.. The long-term trend is classified as Bullish.
What are the key support levels for BHVN?
StockDips.AI has identified key support levels for BHVN at $13.95 and $12.85. These levels may represent potential accumulation zones where buying interest could emerge.
Is BHVN in a significant dip or a Value Dip right now?
BHVN has a Value Score of 74/100. It is currently flagged as a significant dip in the Top Dips list. It is also listed as a Value Dip because long-term sentiment is bullish.
View the full interactive analysis on StockDips.AI.