BHVN Weekly Technical Analysis
Biohaven Ltd
Biopharmaceutical company focused on discovering, developing, and commercializing treatments for diseases in neuroscience, immunology, and oncology
BHVN Technical Analysis Summary
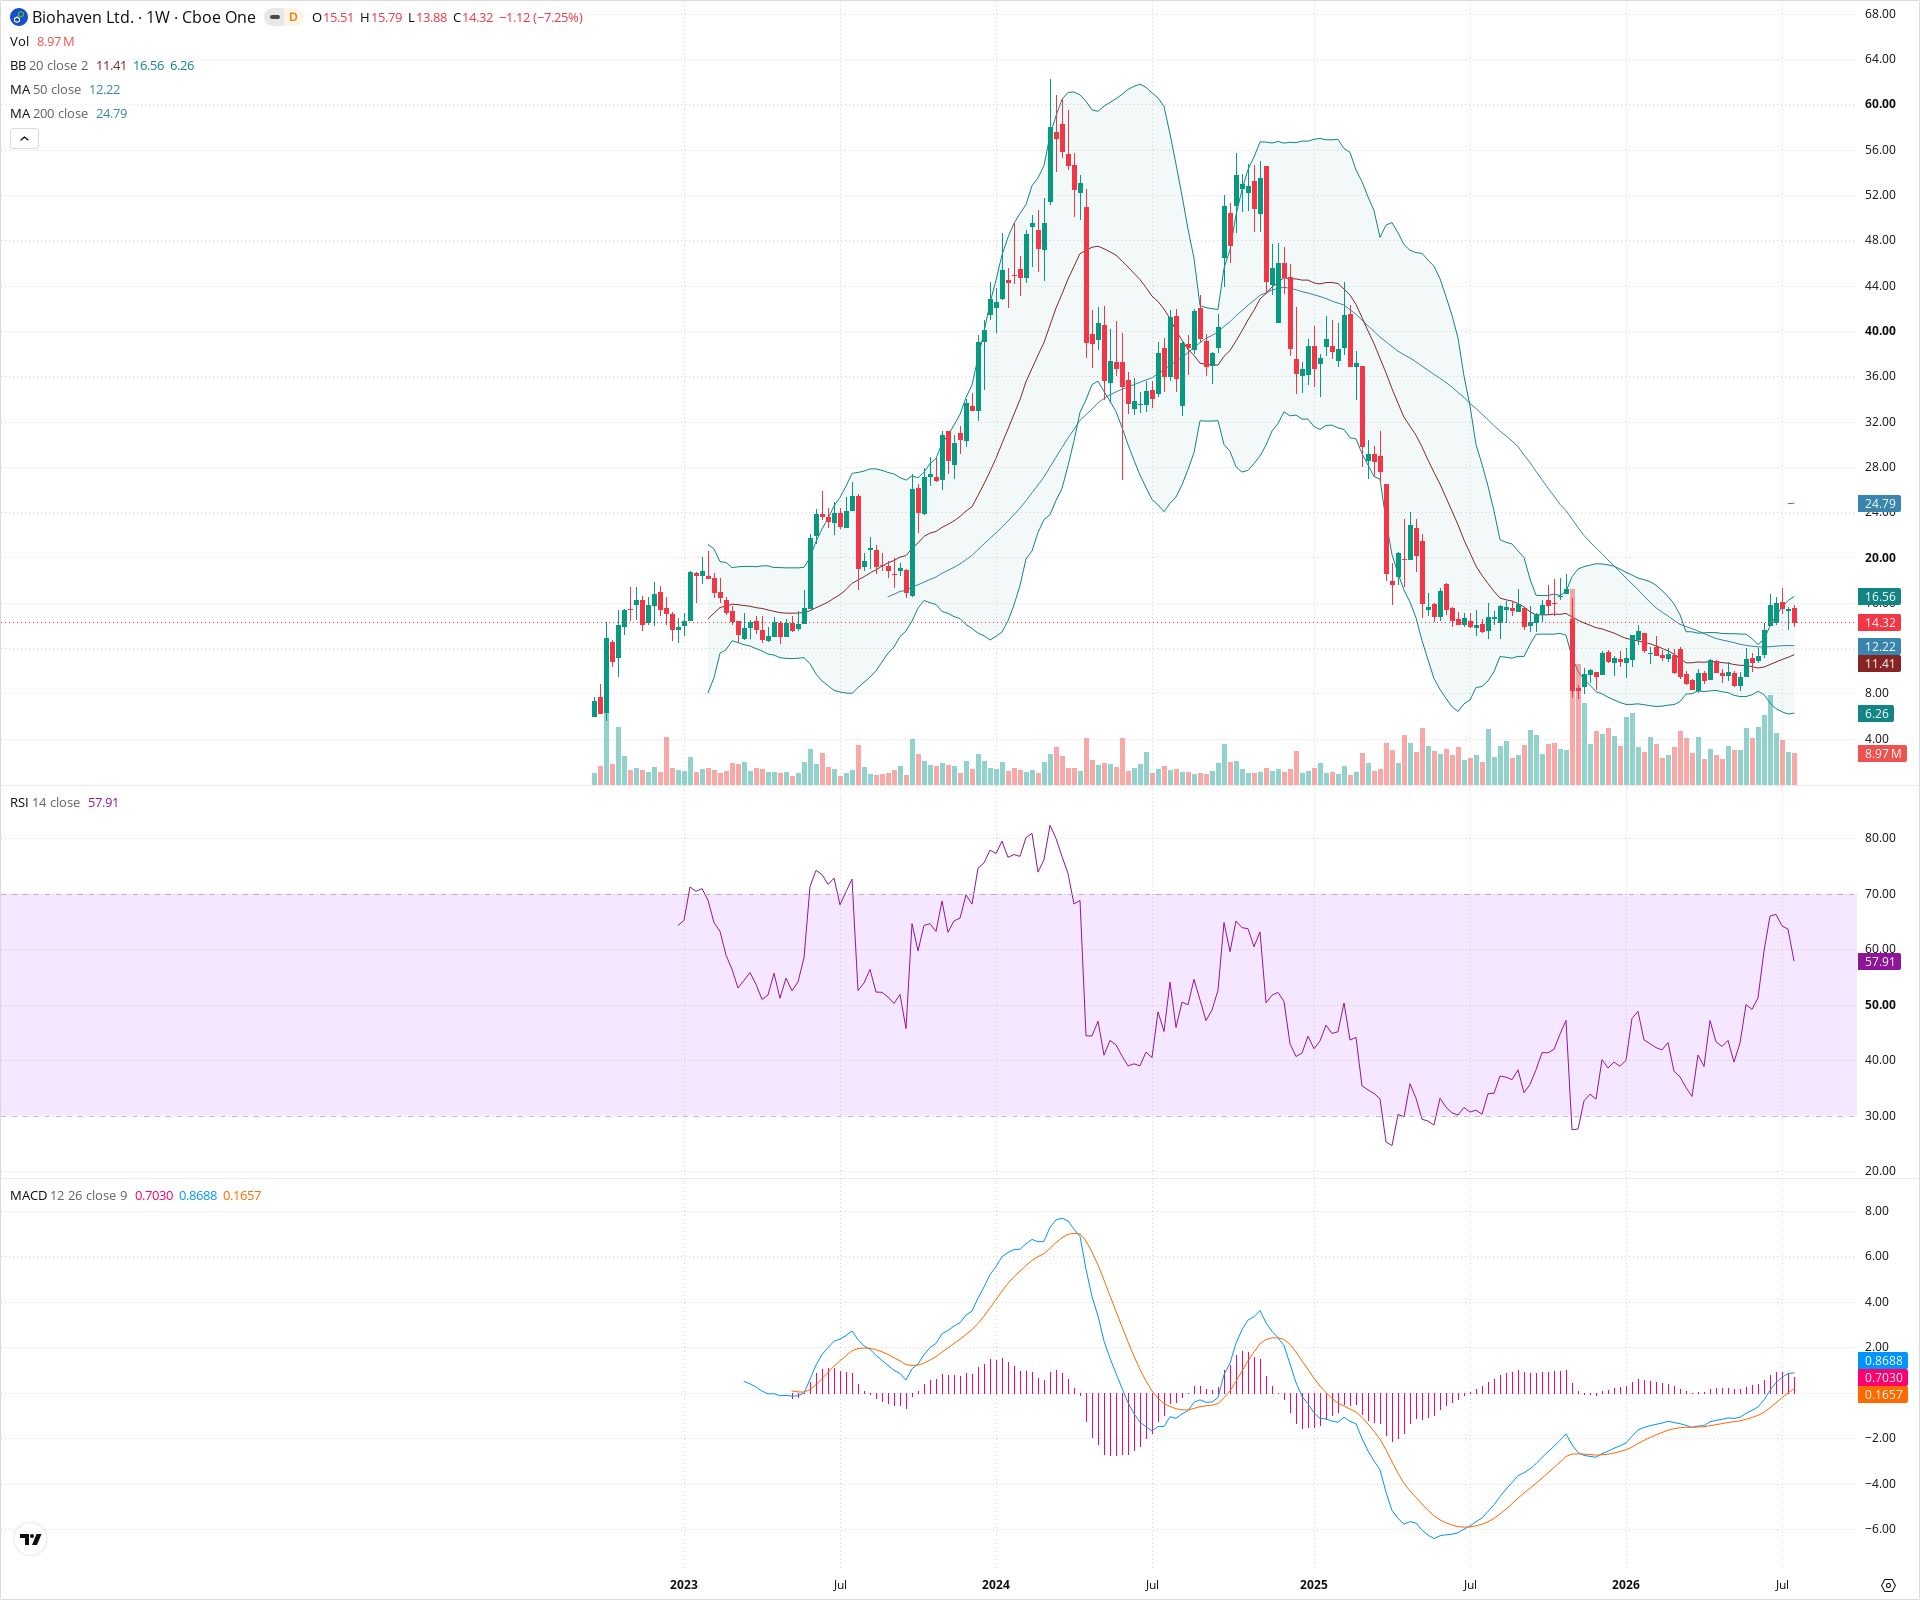
The weekly chart shows BHVN attempting a significant reversal after a prolonged downtrend, having formed a strong base in the $4-6 range. While short-term momentum is bullish as price reclaims the 20-week SMA and RSI pushes higher, the long-term trend remains bearish until major overhead resistance, including the declining 50-week and flat 200-week SMAs, can be overcome. Investors should watch for continued follow-through above $16 as a sign of structural improvement.
Included In Lists
Related Tickers of Interest
BHVN Weekly Chart
Sentiment
Short-term Sentiment (days to weeks): Bullish
Price is rebounding strongly from recent lows, crossing above the 20-week SMA, with RSI rising back above 50.
Long-term Sentiment (weeks to months): Bearish
The stock remains in a protracted downtrend overall, trading below both the 50-week and 200-week SMAs, with the 50-week SMA trending downwards.
Report Metadata
- Timeframe: weekly
- Generated at: 2026-07-25T09:11:35.399Z
- Model: gemini-3.1-pro-preview
Support Price Levels
| Level | Range | Strength | Notes |
|---|---|---|---|
| $9.71 | $8.00 - $11.41 | Weak | Intermediate support around the 20-week SMA and lower consolidation bounds before the recent push higher. |
| $5.13 | $4.00 - $6.26 | Strong | Recent major swing low zone, acting as a strong base for the current reversal. |
Resistance Price Levels
| Level | Range | Strength | Notes |
|---|---|---|---|
| $18.28 | $16.56 - $20.00 | Strong | Immediate overhead resistance zone, aligning with previous consolidation areas and psychological levels. |
| $26.40 | $24.79 - $28.00 | Strong | Major structural resistance zone coinciding with the 200-week SMA and previous breakdown levels. |
| $34.00 | $32.00 - $36.00 | Weak | Higher resistance zone from historical swing highs. |
Potential Chart Patterns in Formation
| Strength | Pattern | Signal | Target | Details |
|---|---|---|---|---|
| Strong | Double Bottom / Basing Pattern | Bullish | $20.00 | Price formed a significant base at the $4-6 level and is now attempting a sustained reversal, pushing above immediate short-term moving averages. |
Frequently Asked Questions about BHVN
What is the current sentiment for BHVN?
The short-term sentiment for BHVN is currently Bullish because Price is rebounding strongly from recent lows, crossing above the 20-week SMA, with RSI rising back above 50.. The long-term trend is classified as Bearish.
What are the key support levels for BHVN?
StockDips.AI has identified key support levels for BHVN at $9.71 and $5.13. These levels may represent potential accumulation zones where buying interest could emerge.
Is BHVN in a significant dip or a Value Dip right now?
BHVN has a Value Score of 74/100. It is currently flagged as a significant dip in the Top Dips list. It is not listed as a Value Dip because the long-term sentiment or value-score threshold does not qualify.
View the full interactive analysis on StockDips.AI.