BMNR Daily Technical Analysis
BitMine Immersion Technologies Inc
Developer of immersion cooling technology for crypto mining equipment.
BMNR Technical Analysis Summary
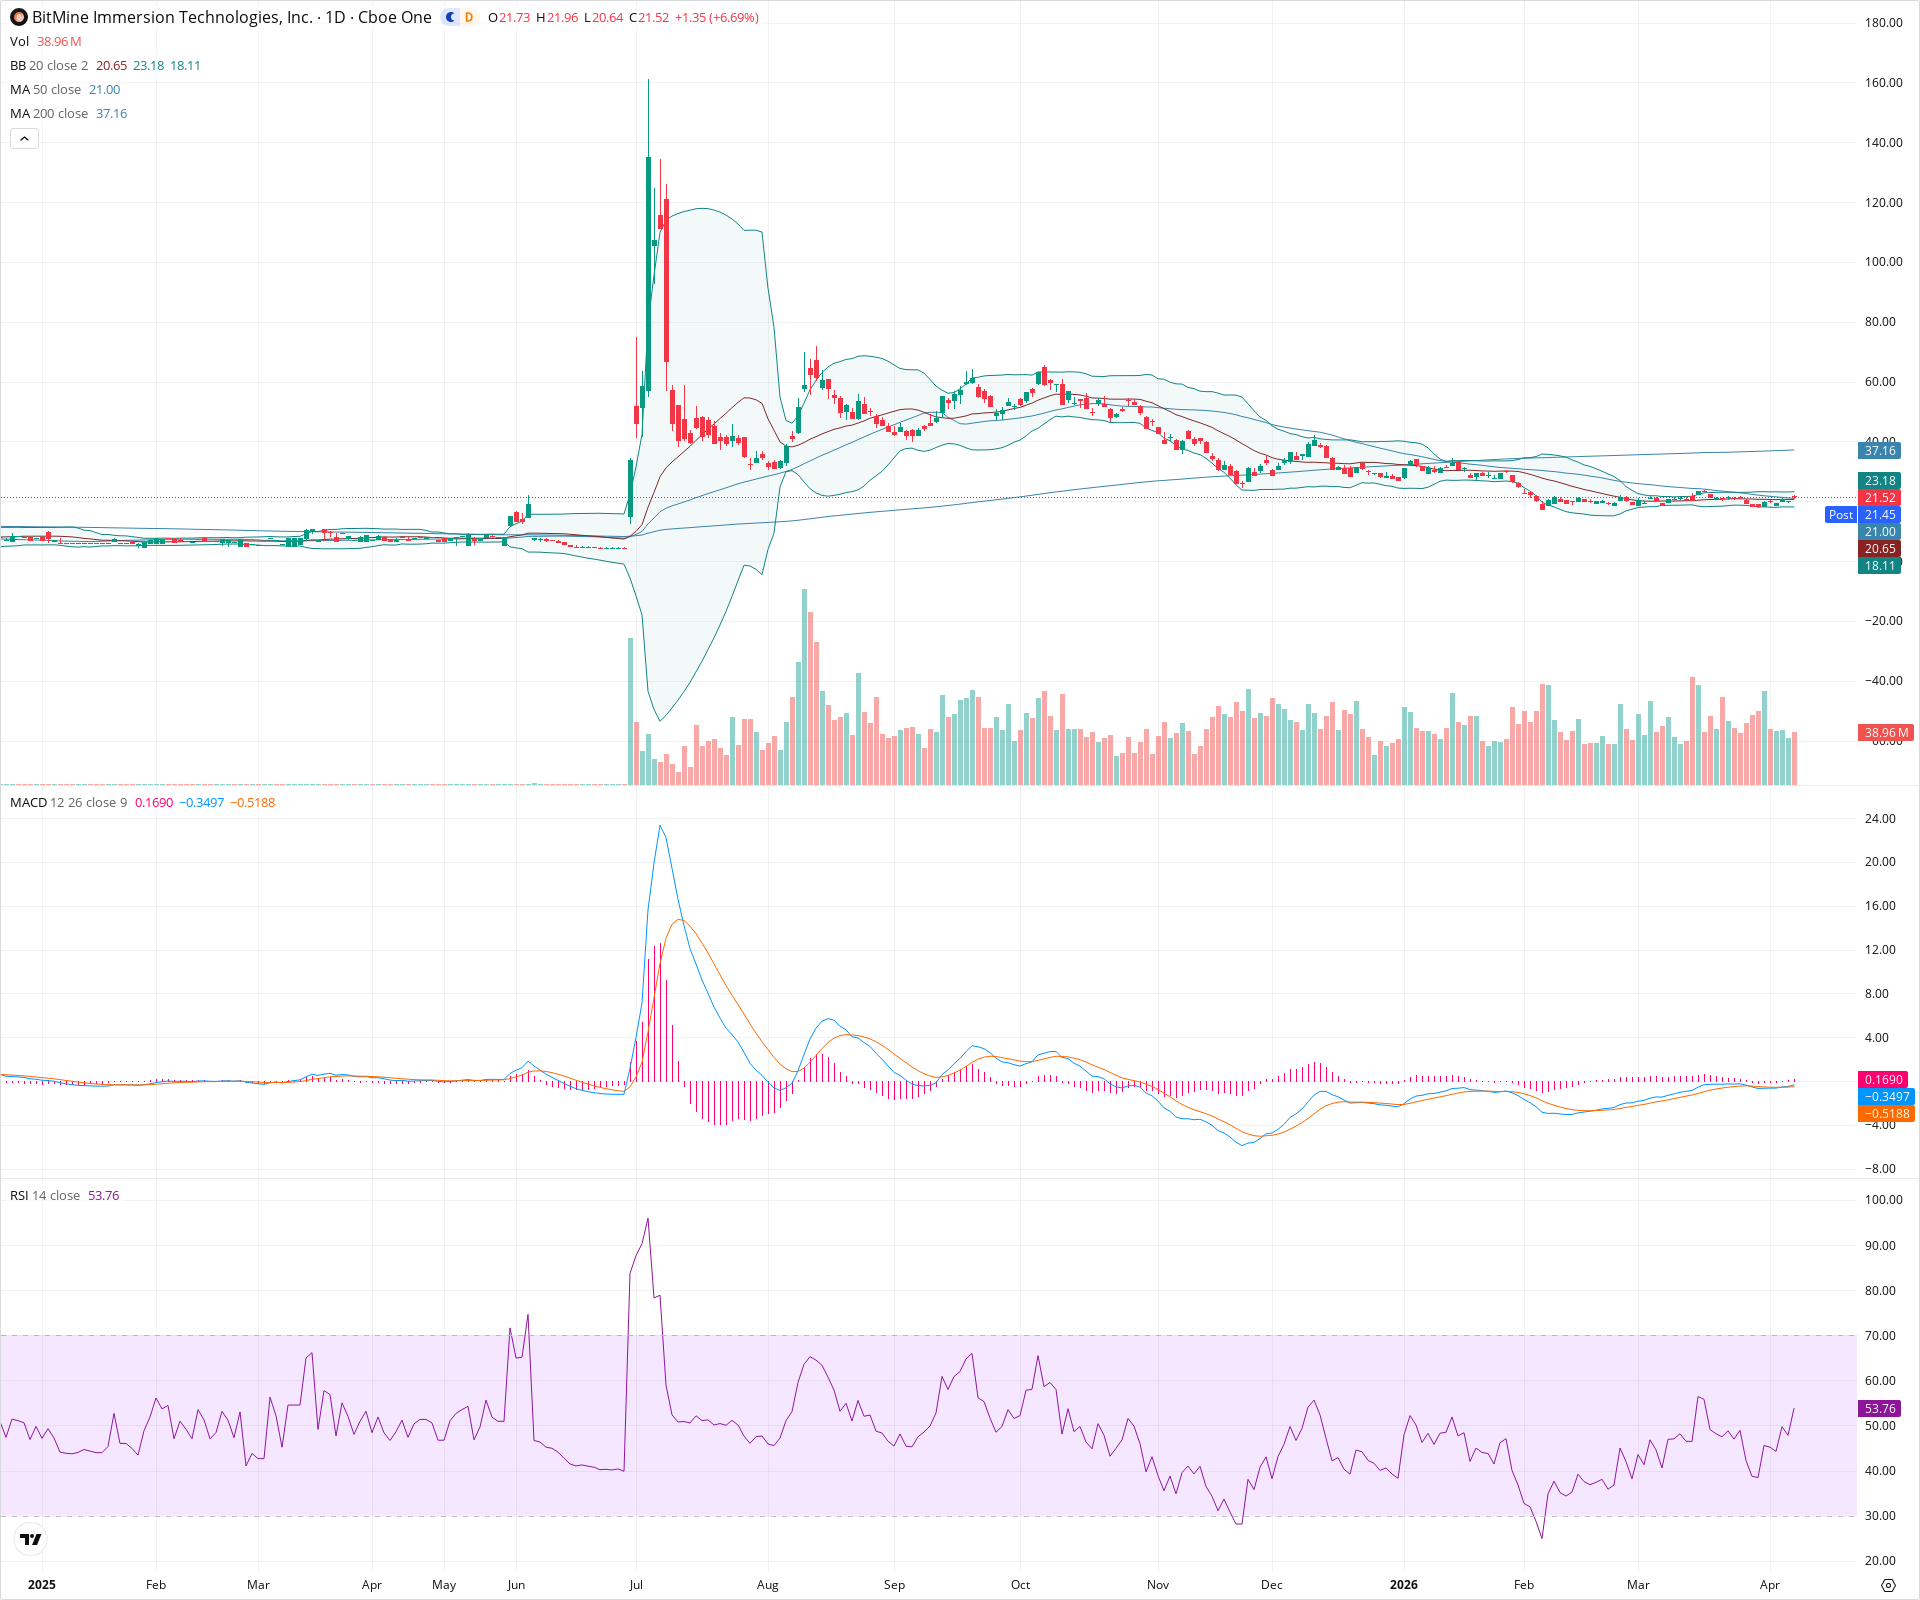
BMNR has experienced a significant decline but appears to be attempting to build a base in recent months. Short-term sentiment is slightly bullish as price has moved above the 20 and 50-day SMAs with supportive MACD and RSI readings. However, long-term sentiment remains bearish as the price is well below a declining 200-day SMA. A sustained break above the 200-day SMA would be required to shift the long-term technical picture.
Included In Lists
Related Tickers of Interest
BMNR Daily Chart
Sentiment
Short-term Sentiment (days to weeks): Bullish
Price is trading above its 20 and 50-day SMAs. Recent price action indicates a potential base building. RSI is in bullish territory above 50, and MACD shows a bullish crossover with positive histogram expansion.
Long-term Sentiment (weeks to months): Bearish
Price remains below the 200-day SMA, which is trending slightly downwards, suggesting a longer-term bearish bias despite recent short-term recovery.
Report Metadata
- Timeframe: daily
- Generated at: 2026-04-08T21:18:23.434Z
- Model: gemini-3.1-pro-preview
Support Price Levels
| Level | Range | Strength | Notes |
|---|---|---|---|
| $20.83 | $20.65 - $21.00 | Strong | Convergence area of the 20-day and 50-day SMAs, providing near-term dynamic support. |
| $18.50 | $18.00 - $19.00 | Strong | Recent swing low support zone from earlier in the year. |
Resistance Price Levels
| Level | Range | Strength | Notes |
|---|---|---|---|
| $23.50 | $23.00 - $24.00 | Weak | Upper Bollinger Band and minor recent swing highs. |
| $37.50 | $37.00 - $38.00 | Strong | Significant resistance near the 200-day SMA and prior historical consolidation zones. |
Potential Chart Patterns in Formation
| Strength | Pattern | Signal | Target | Details |
|---|---|---|---|---|
| Strong | Base Building / Consolidation | Neutral | N/A | Price has been consolidating sideways in recent months after a significant downtrend, attempting to build a base. This is supported by flattening shorter-term MAs and a relatively stable RSI. |
Frequently Asked Questions about BMNR
What is the current sentiment for BMNR?
The short-term sentiment for BMNR is currently Bullish because Price is trading above its 20 and 50-day SMAs. Recent price action indicates a potential base building. RSI is in bullish territory above 50, and MACD shows a bullish crossover with positive histogram expansion.. The long-term trend is classified as Bearish.
What are the key support levels for BMNR?
StockDips.AI has identified key support levels for BMNR at $20.83 and $18.50. These levels may represent potential accumulation zones where buying interest could emerge.
Is BMNR in a significant dip or a Value Dip right now?
BMNR has a Value Score of 288/100. It is not currently flagged as a significant dip in the Top Dips list. It is not listed as a Value Dip because the long-term sentiment or value-score threshold does not qualify.
View the full interactive analysis on StockDips.AI.