HUT Daily Technical Analysis
Hut 8 Corp
North American digital asset mining and infrastructure company focused on Bitcoin mining and high-performance computing data centers. Following its merger with US Bitcoin Corp, Hut 8 operates large-scale mining facilities and provides hosting and infrastructure services.
HUT Technical Analysis Summary
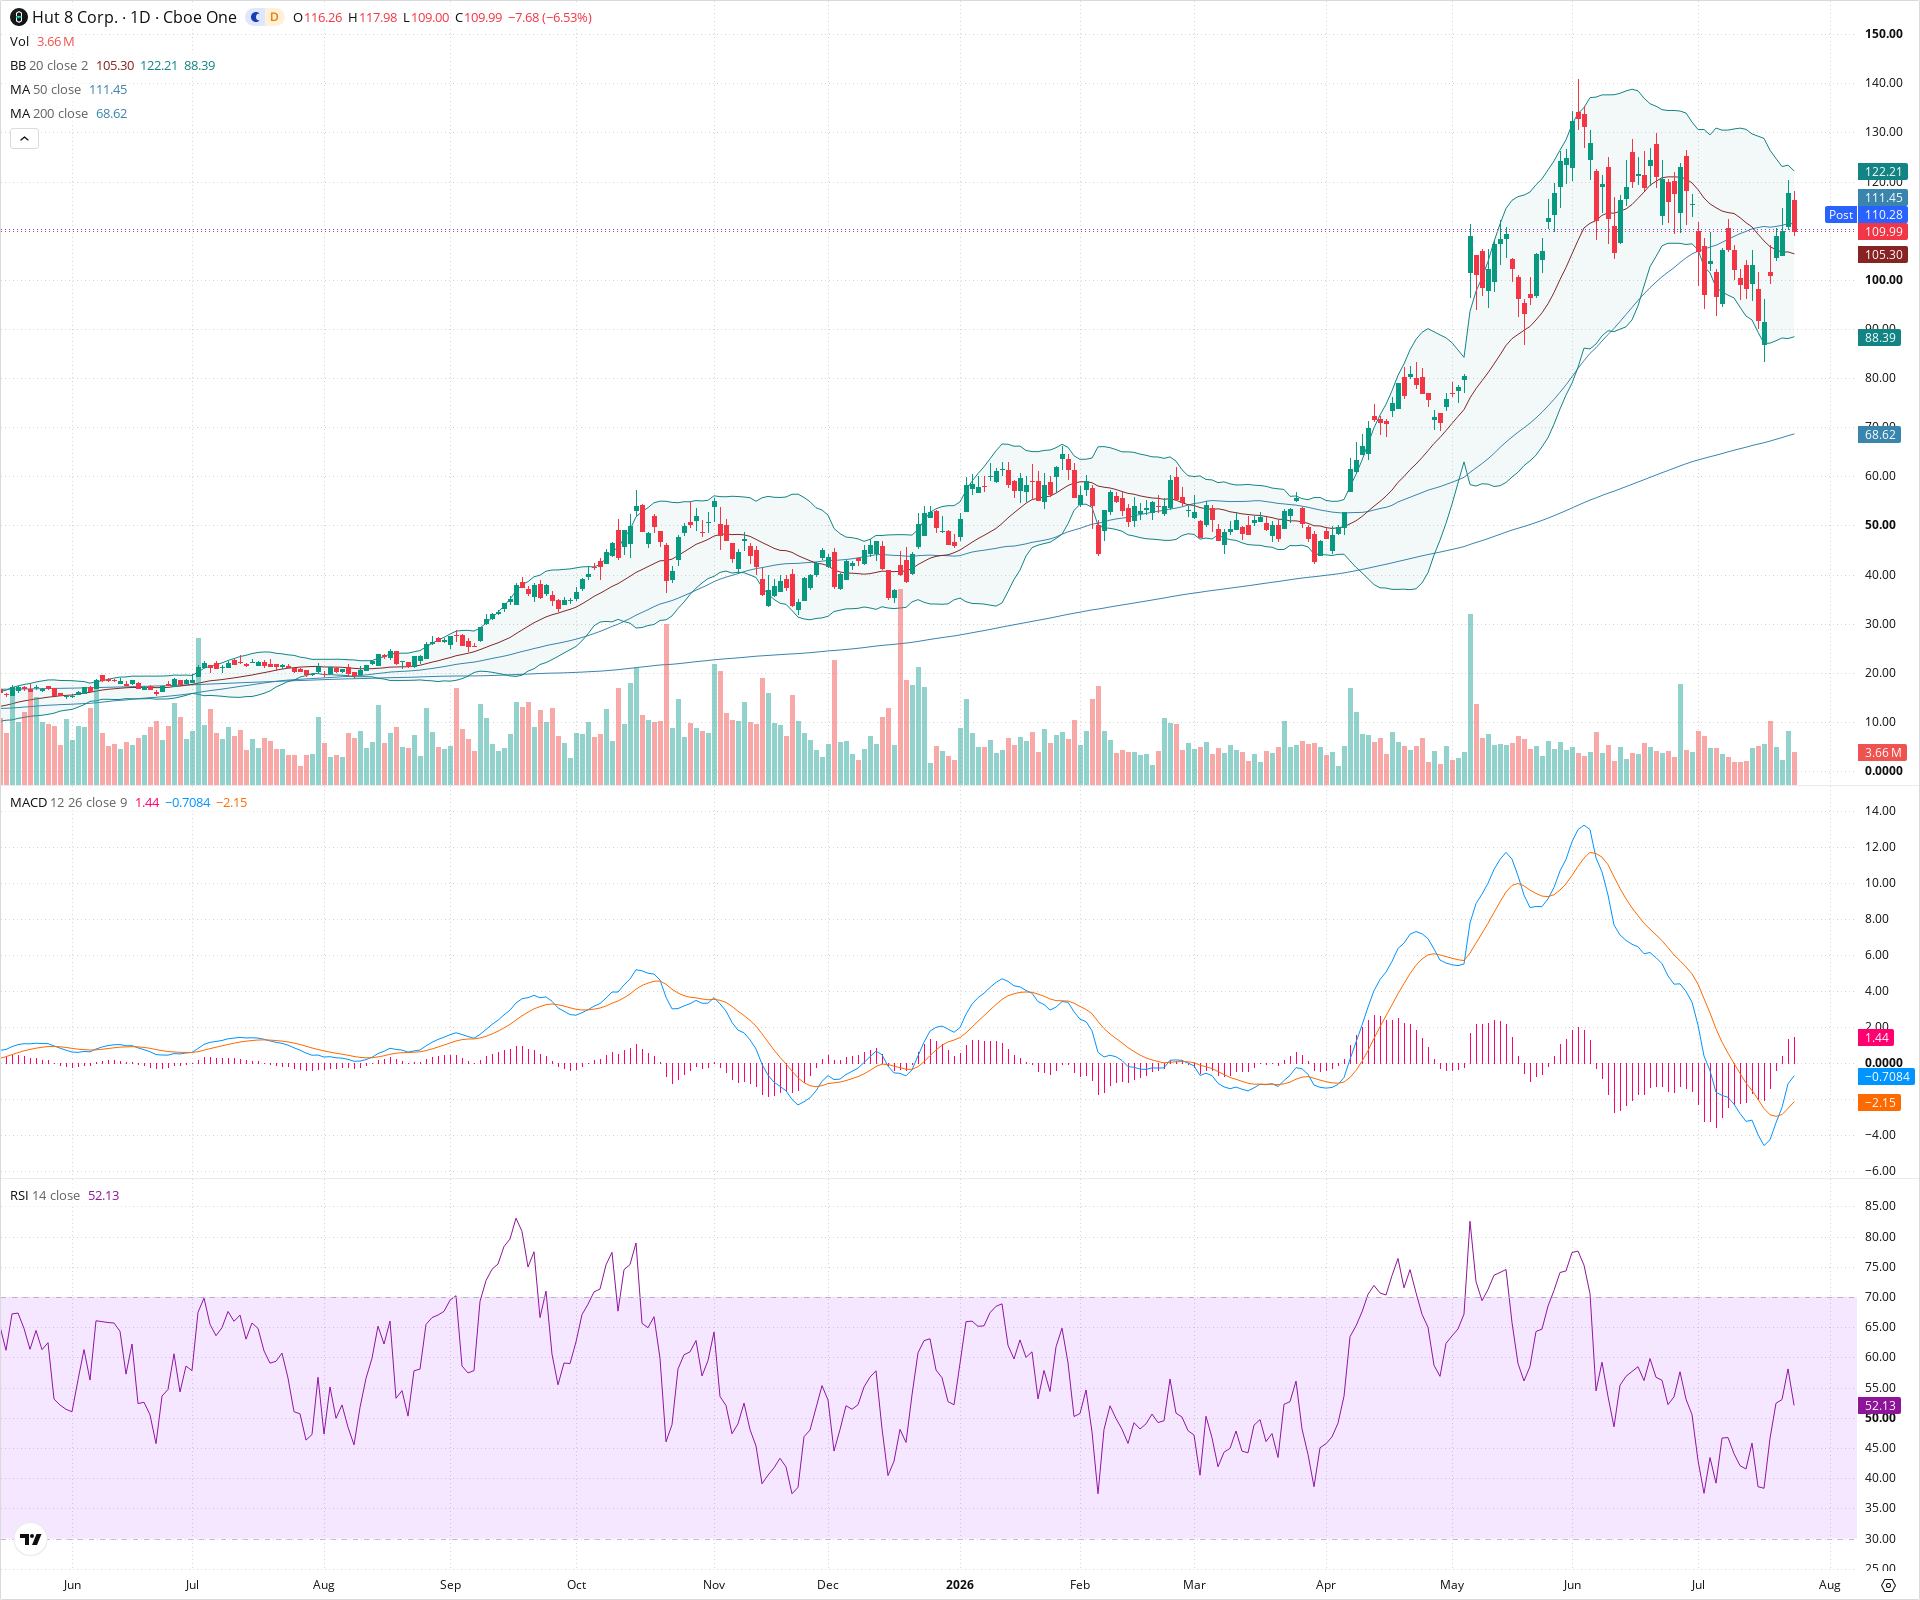
HUT maintains a strong long-term bullish posture, trading well above its 200-day SMA despite a recent sharp correction. The stock has found support in the 80-90 range, and short-term indicators like the MACD and RSI suggest a momentum shift to the upside. The immediate technical test for this relief rally lies at the 50-day SMA and the 111-122 resistance zone.
Included In Lists
Related Tickers of Interest
HUT Daily Chart
Sentiment
Short-term Sentiment (days to weeks): Bullish
Short-term momentum has shifted positive with a recent bullish MACD crossover, a rising positive histogram, and RSI climbing back above the 50 level as price rebounds from recent lows.
Long-term Sentiment (weeks to months): Bullish
The primary trend remains strongly upward, evidenced by price trading significantly above a rising 200-day SMA and maintaining a macro structure of higher highs and higher lows prior to the recent pullback.
Report Metadata
- Timeframe: daily
- Generated at: 2026-07-24T21:11:20.401Z
- Model: gemini-3.1-pro-preview
Support Price Levels
| Level | Range | Strength | Notes |
|---|---|---|---|
| $85.00 | $80.00 - $90.00 | Strong | Recent swing low consolidation zone acting as a base for the current bounce. |
| $70.00 | $65.00 - $75.00 | Strong | Dynamic support area aligning with the rising 200-day SMA and historical price congestion. |
Resistance Price Levels
| Level | Range | Strength | Notes |
|---|---|---|---|
| $116.50 | $111.00 - $122.00 | Moderate | Immediate resistance zone containing the 50-day SMA and previous price support turned resistance. |
| $140.00 | $135.00 - $145.00 | Strong | Major swing high peak representing the current top of the macro uptrend. |
Potential Chart Patterns in Formation
| Strength | Pattern | Signal | Target | Details |
|---|---|---|---|---|
| Moderate | Relief Rally / Momentum Shift | Bullish | $122.00 | Following a steep correction from the highs, the asset is experiencing a bounce. This is confirmed by a bullish MACD crossover and RSI crossing its midline, indicating recovering short-term strength. |
Frequently Asked Questions about HUT
What is the current sentiment for HUT?
The short-term sentiment for HUT is currently Bullish because Short-term momentum has shifted positive with a recent bullish MACD crossover, a rising positive histogram, and RSI climbing back above the 50 level as price rebounds from recent lows.. The long-term trend is classified as Bullish.
What are the key support levels for HUT?
StockDips.AI has identified key support levels for HUT at $85.00 and $70.00. These levels may represent potential accumulation zones where buying interest could emerge.
Is HUT in a significant dip or a Value Dip right now?
HUT has a Value Score of 21/100. It is not currently flagged as a significant dip in the Top Dips list. It is not listed as a Value Dip because the long-term sentiment or value-score threshold does not qualify.
View the full interactive analysis on StockDips.AI.