BRK.B Weekly Technical Analysis
Berkshire Hathaway
A diversified global conglomerate spanning insurance, railroads, energy, and consumer brands.
BRK.B Technical Analysis Summary
BRK.B remains in a robust long-term uptrend, visually confirmed by rising moving averages and a broader structure of higher highs and higher lows. However, the stock is currently undergoing a healthy multi-week consolidation phase, allowing momentum indicators to reset to neutral territory. In the short to medium term, price action is range-bound, and a decisive breakout above ~525 is required to signal a resumption of the primary upward trajectory.
Included In Lists
Related Tickers of Interest
BRK.B Weekly Chart
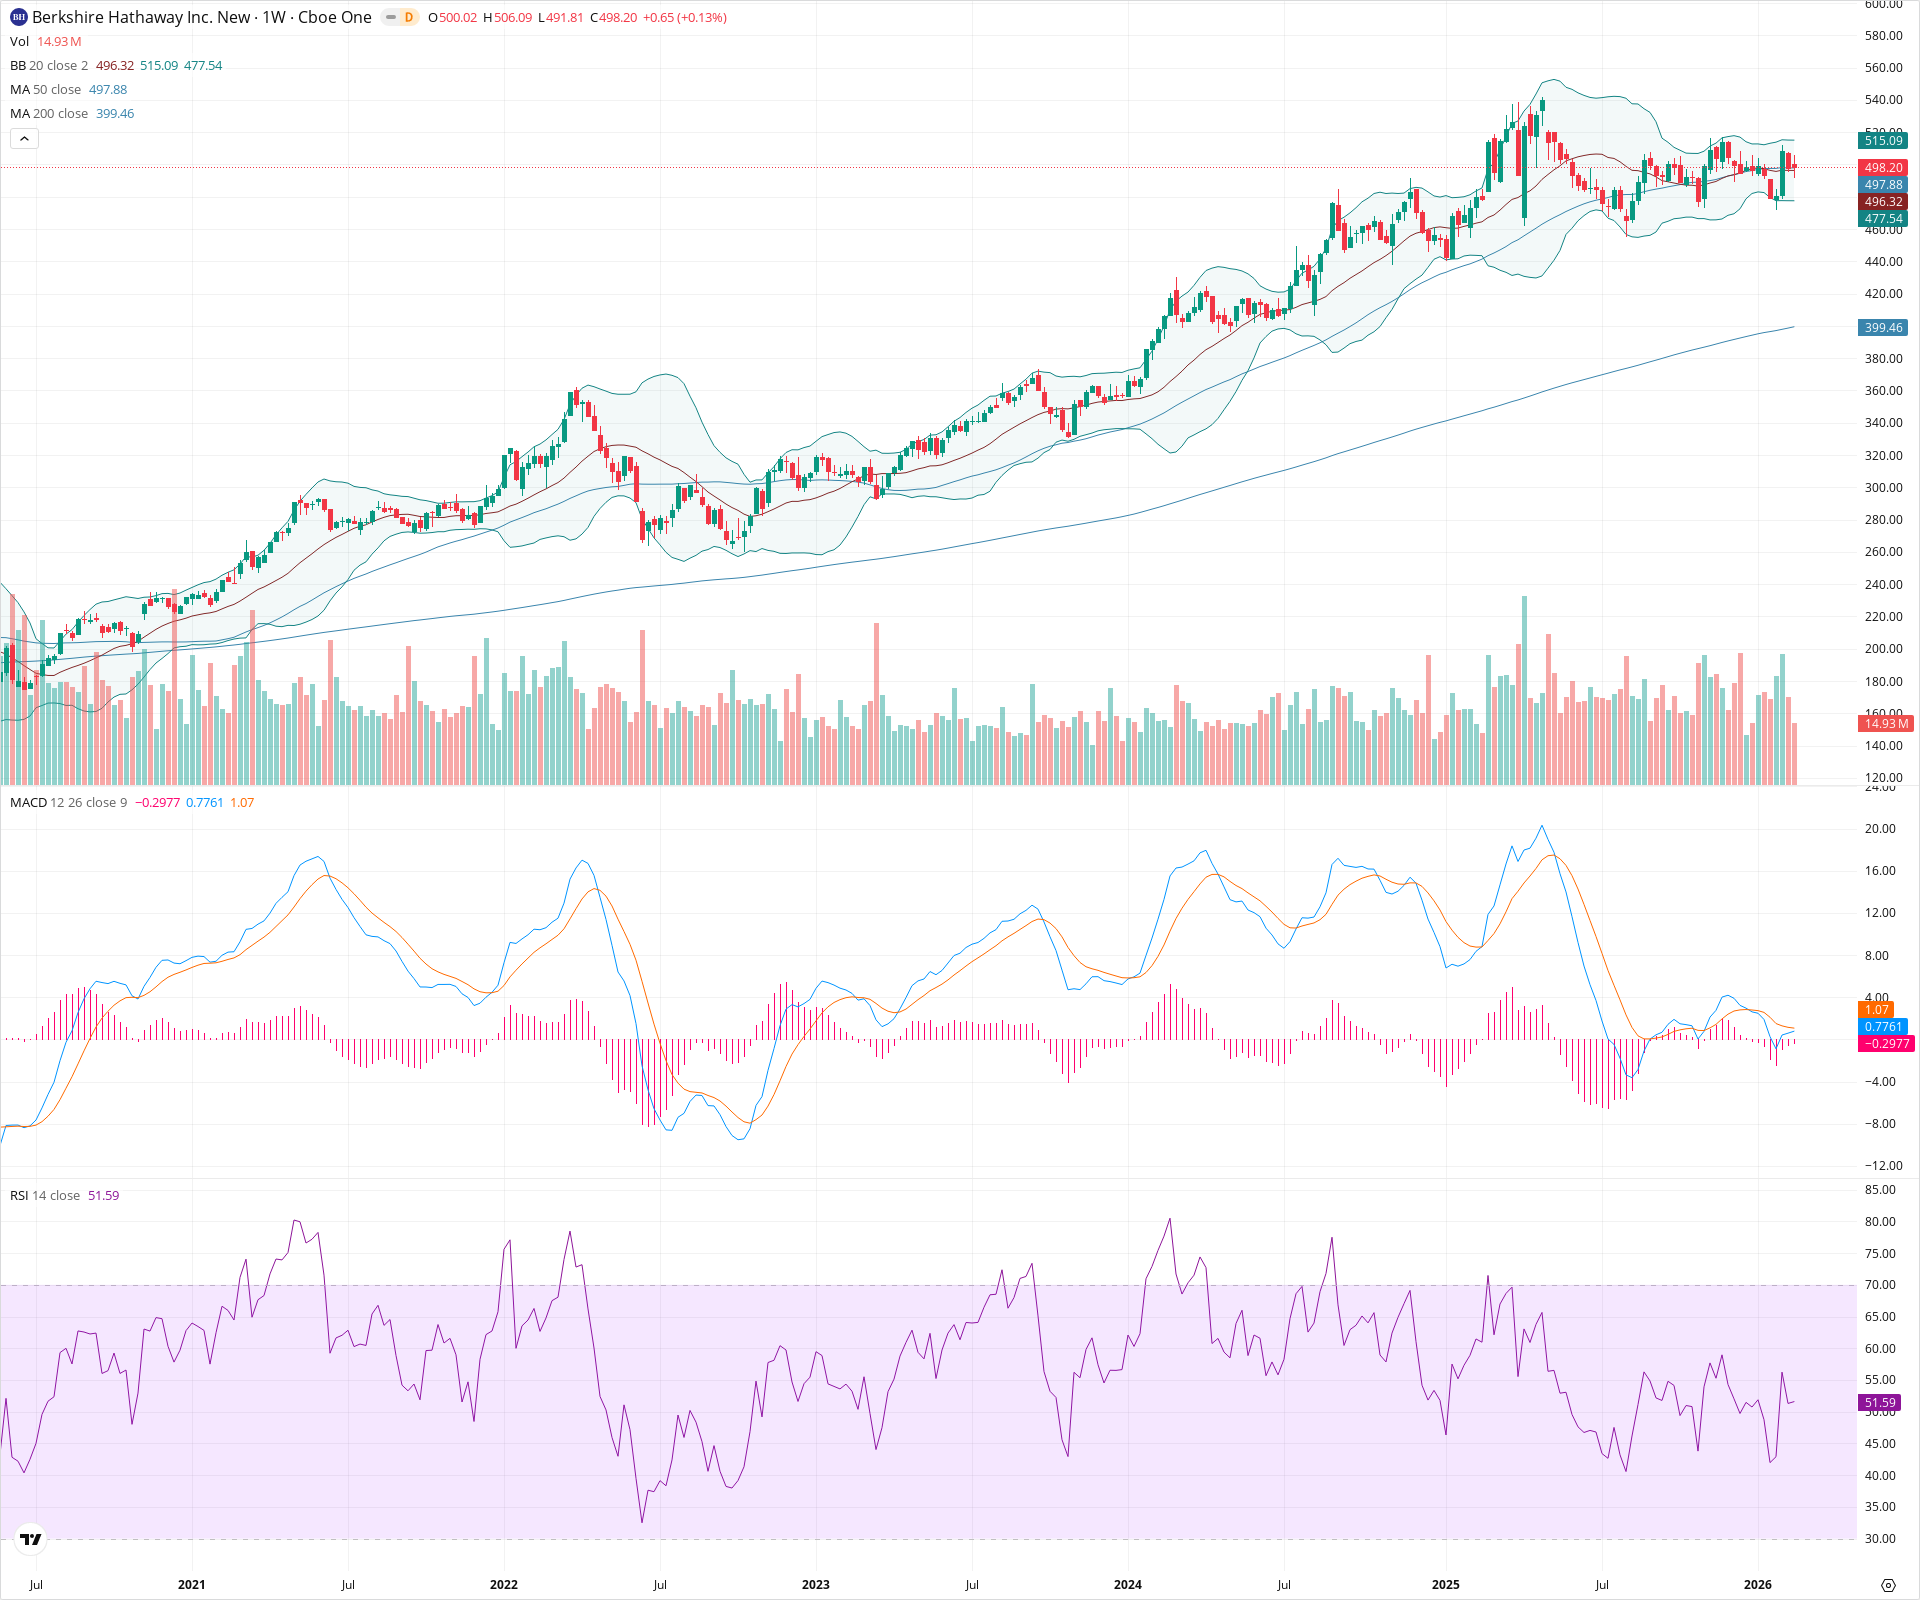
Sentiment
Short-term Sentiment (days to weeks): Neutral
Price is consolidating in a sideways range around the 20-week and 50-week SMAs. Momentum indicators like RSI are near the 50 level, and MACD is flat near the zero line, indicating a lack of clear near-term directional momentum.
Long-term Sentiment (weeks to months): Bullish
The primary multi-year trend remains firmly intact, characterized by a sequence of higher highs and higher lows. The 200-week SMA continues to rise steadily, providing an upward sloping floor for the long-term trend.
Report Metadata
- Timeframe: weekly
- Generated at: 2026-02-21T18:33:16.013Z
- Model: gemini-3.1-pro-preview
Support Price Levels
| Level | Range | Strength | Notes |
|---|---|---|---|
| $467.50 | $460.00 - $475.00 | Strong | Recent structural higher low and lower bound of the current consolidation zone. |
| $395.00 | $380.00 - $410.00 | Strong | Major previous resistance turned support area, currently coinciding with the rising 200-week SMA. |
Resistance Price Levels
| Level | Range | Strength | Notes |
|---|---|---|---|
| $520.00 | $515.00 - $525.00 | Weak | Near-term resistance defined by recent lower highs within the ongoing consolidation. |
| $540.00 | $535.00 - $545.00 | Strong | All-time high resistance zone established prior to the current multi-week pullback. |
Potential Chart Patterns in Formation
| Strength | Pattern | Signal | Target | Details |
|---|---|---|---|---|
| Strong | Consolidation Phase | Neutral | N/A | Price is moving sideways following a significant uptrend, digesting gains between roughly 460 and 520, resetting overbought conditions. |
Frequently Asked Questions about BRK.B
What is the current sentiment for BRK.B?
The short-term sentiment for BRK.B is currently Neutral because Price is consolidating in a sideways range around the 20-week and 50-week SMAs. Momentum indicators like RSI are near the 50 level, and MACD is flat near the zero line, indicating a lack of clear near-term directional momentum.. The long-term trend is classified as Bullish.
What are the key support levels for BRK.B?
StockDips.AI has identified key support levels for BRK.B at $467.50 and $395.00. These levels may represent potential accumulation zones where buying interest could emerge.
Is BRK.B in a significant dip or a Value Dip right now?
BRK.B has a Value Score of 76/100. It is currently flagged as a significant dip in the Top Dips list. It is also listed as a Value Dip because long-term sentiment is bullish.
View the full interactive analysis on StockDips.AI.