CBRL Daily Technical Analysis
Cracker Barrel Old Country Store Inc
Cracker Barrel operates a unique hybrid business model consisting of full-service restaurants paired with attached retail gift shops across the United States. They specialize in serving home-style Southern country cuisine while selling nostalgic retail merchandise, such as toys, apparel, and their signature rocking chairs.
CBRL Technical Analysis Summary
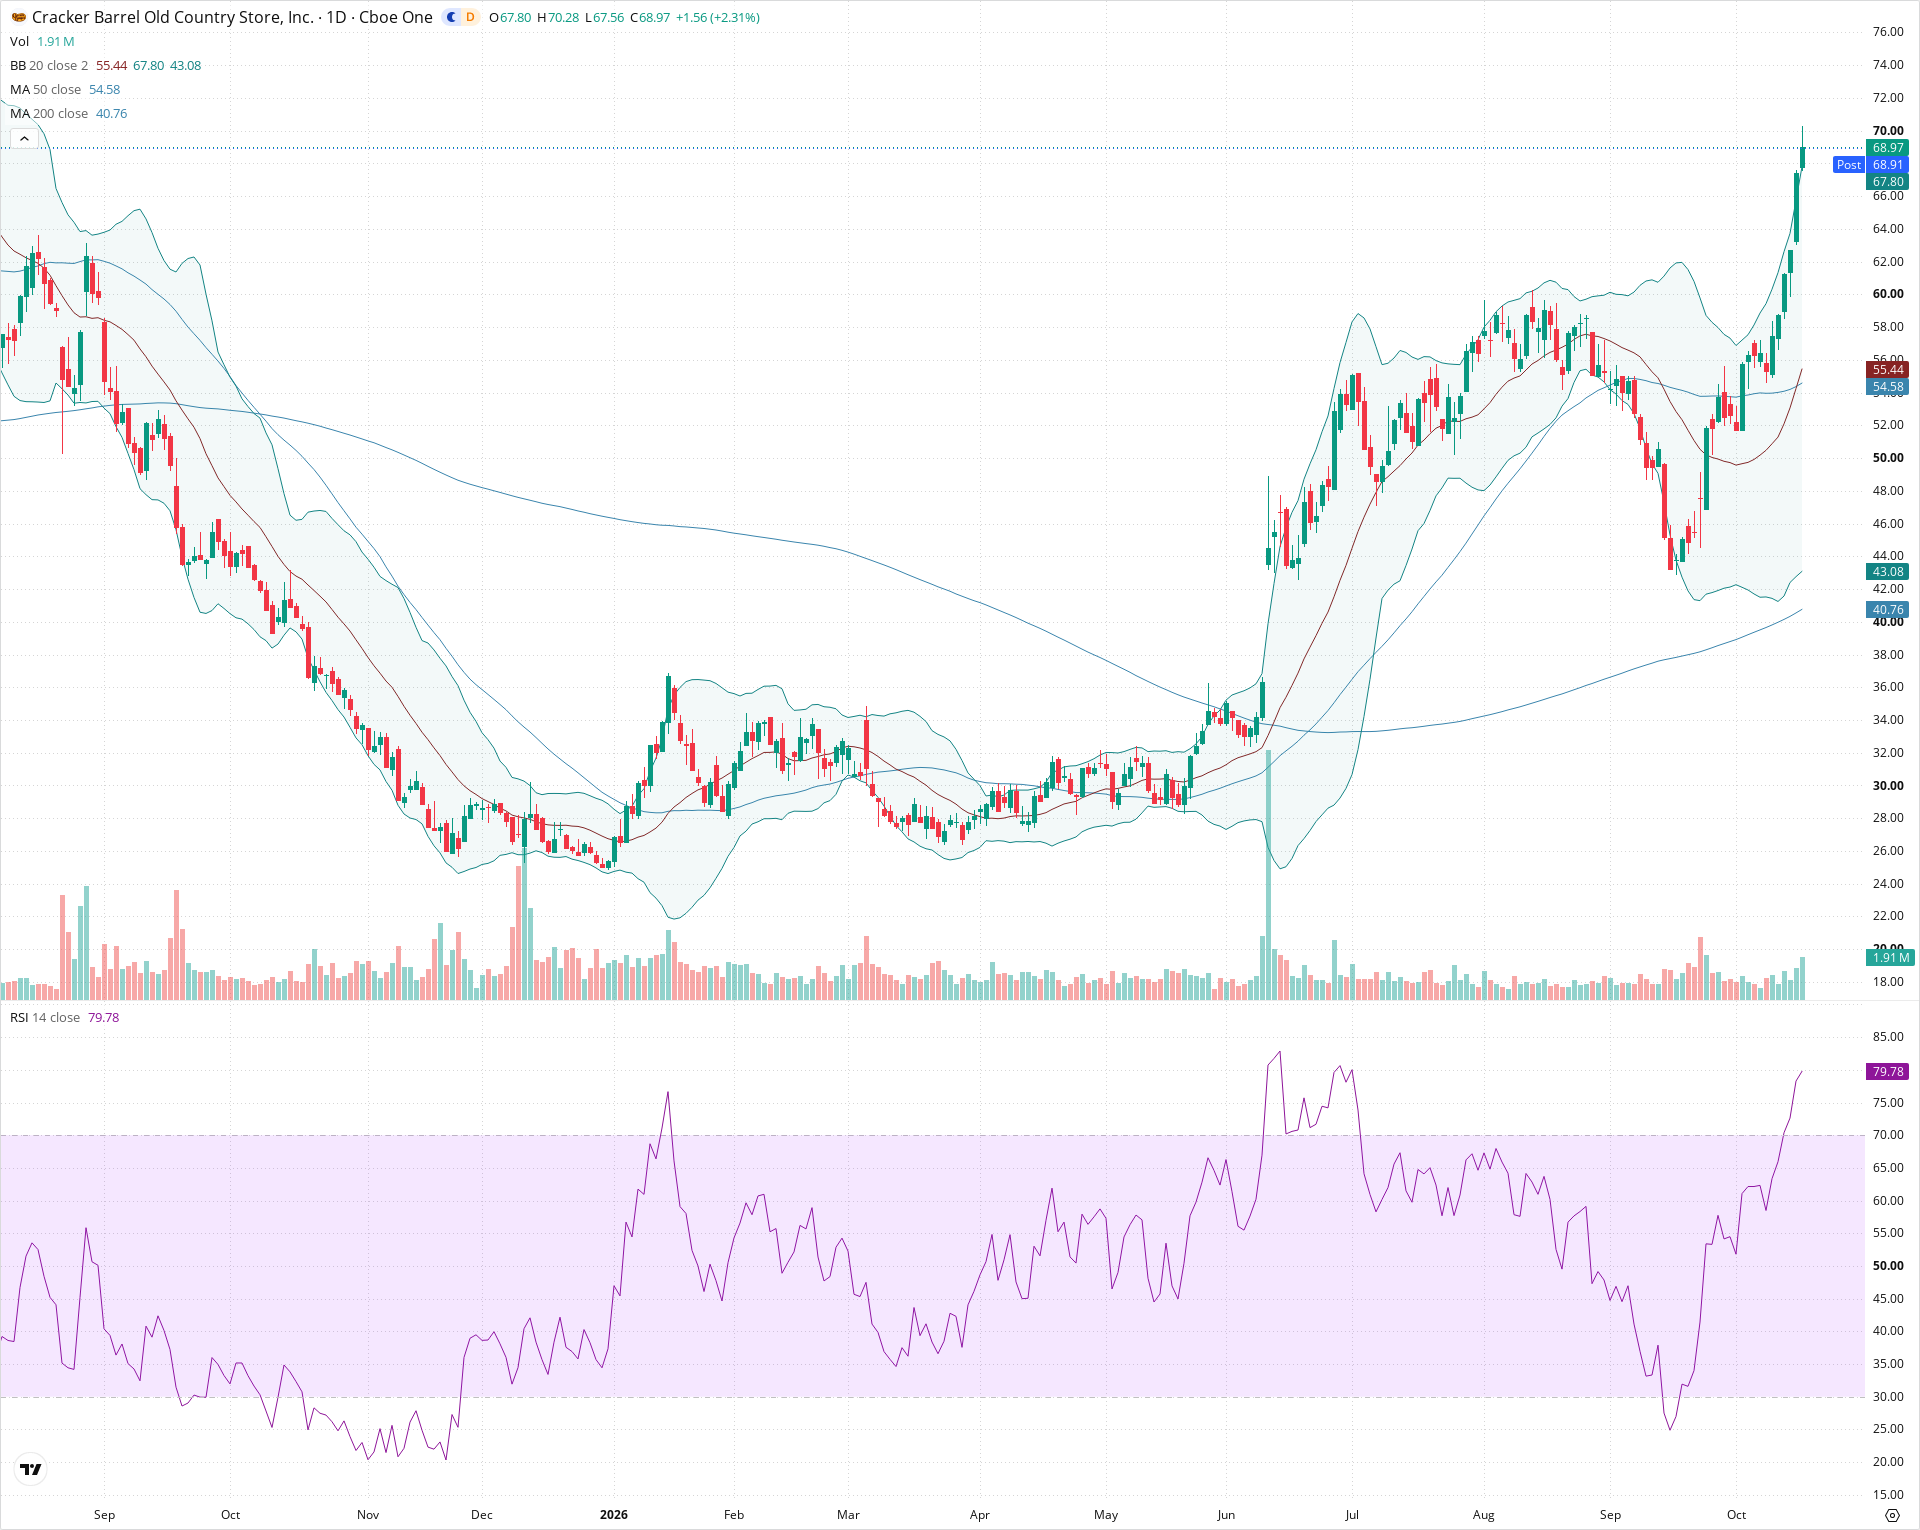
CBRL is in a well-defined primary uptrend, supported by upward-sloping 50-day and 200-day moving averages and confirmed by a clean breakout above previous multi-month resistance around 61.00. While the daily RSI above 79 indicates near-term overbought conditions that could prompt brief consolidation near the 70.00 level, the broader structural trend remains distinctly positive. Long-term investors should watch for potential pullbacks toward the 59.00–61.50 breakout shelf as healthy retest opportunities within the dominant upward advance.
Included In Lists
Related Tickers of Interest
CBRL Daily Chart
Sentiment
Short-term Sentiment (days to weeks): Bullish
Price is aggressively breaking out to new local highs above the upper Bollinger Band with expanding bullish volume and strong upward momentum.
Long-term Sentiment (weeks to months): Bullish
Price is trending firmly above both rising 50-day (54.58) and 200-day (40.76) moving averages, extending a sustained multi-month uptrend of higher highs and higher lows.
Report Metadata
- Timeframe: daily
- Generated at: 2026-10-16T23:52:33.862Z
- Model: gemini-3.8-flash
Support Price Levels
| Level | Range | Strength | Notes |
|---|---|---|---|
| $60.25 | $59.00 - $61.50 | Moderate | Prior swing high resistance from August/September, now acting as breakout support. |
| $54.50 | $53.50 - $55.50 | Strong | Confluence of the 20-day SMA/middle Bollinger Band and the rising 50-day moving average. |
| $44.50 | $43.00 - $46.00 | Moderate | Late September swing low base that launched the current impulsive leg. |
Resistance Price Levels
| Level | Range | Strength | Notes |
|---|---|---|---|
| $70.50 | $70.00 - $71.00 | Moderate | Current session high (70.28) and key psychological round-number resistance. |
| $75.00 | $74.00 - $76.00 | Weak | Major upper overhead resistance zone from the upper boundary of the multi-month chart range. |
Potential Chart Patterns in Formation
| Strength | Pattern | Signal | Target | Details |
|---|---|---|---|---|
| Strong | Bollinger Band Expansion Breakout | Bullish | $75.00 | Price has ridden above the upper Bollinger Band with rising green volume bars, signaling powerful trend continuation. |
| Moderate | V-Shaped Recovery / Breakout | Bullish | $76.00 | Aggressive rebound from the September low near 43.00, slicing through the previous 61.00 high without hesitation. |
Frequently Asked Questions about CBRL
What is the current sentiment for CBRL?
The short-term sentiment for CBRL is currently Bullish because Price is aggressively breaking out to new local highs above the upper Bollinger Band with expanding bullish volume and strong upward momentum.. The long-term trend is classified as Bullish.
What are the key support levels for CBRL?
StockDips.AI has identified key support levels for CBRL at $60.25 and $54.50. These levels may represent potential accumulation zones where buying interest could emerge.
Is CBRL in a significant dip or a Value Dip right now?
CBRL has a Value Score of 15/100. It is not currently flagged as a significant dip in the Top Dips list. It is not listed as a Value Dip because the long-term sentiment or value-score threshold does not qualify.
View the full interactive analysis on StockDips.AI.