TXRH Daily Technical Analysis
Texas Roadhouse Inc
Chain of family steakhouses known for hand-cut steaks and casual dining.
TXRH Technical Analysis Summary
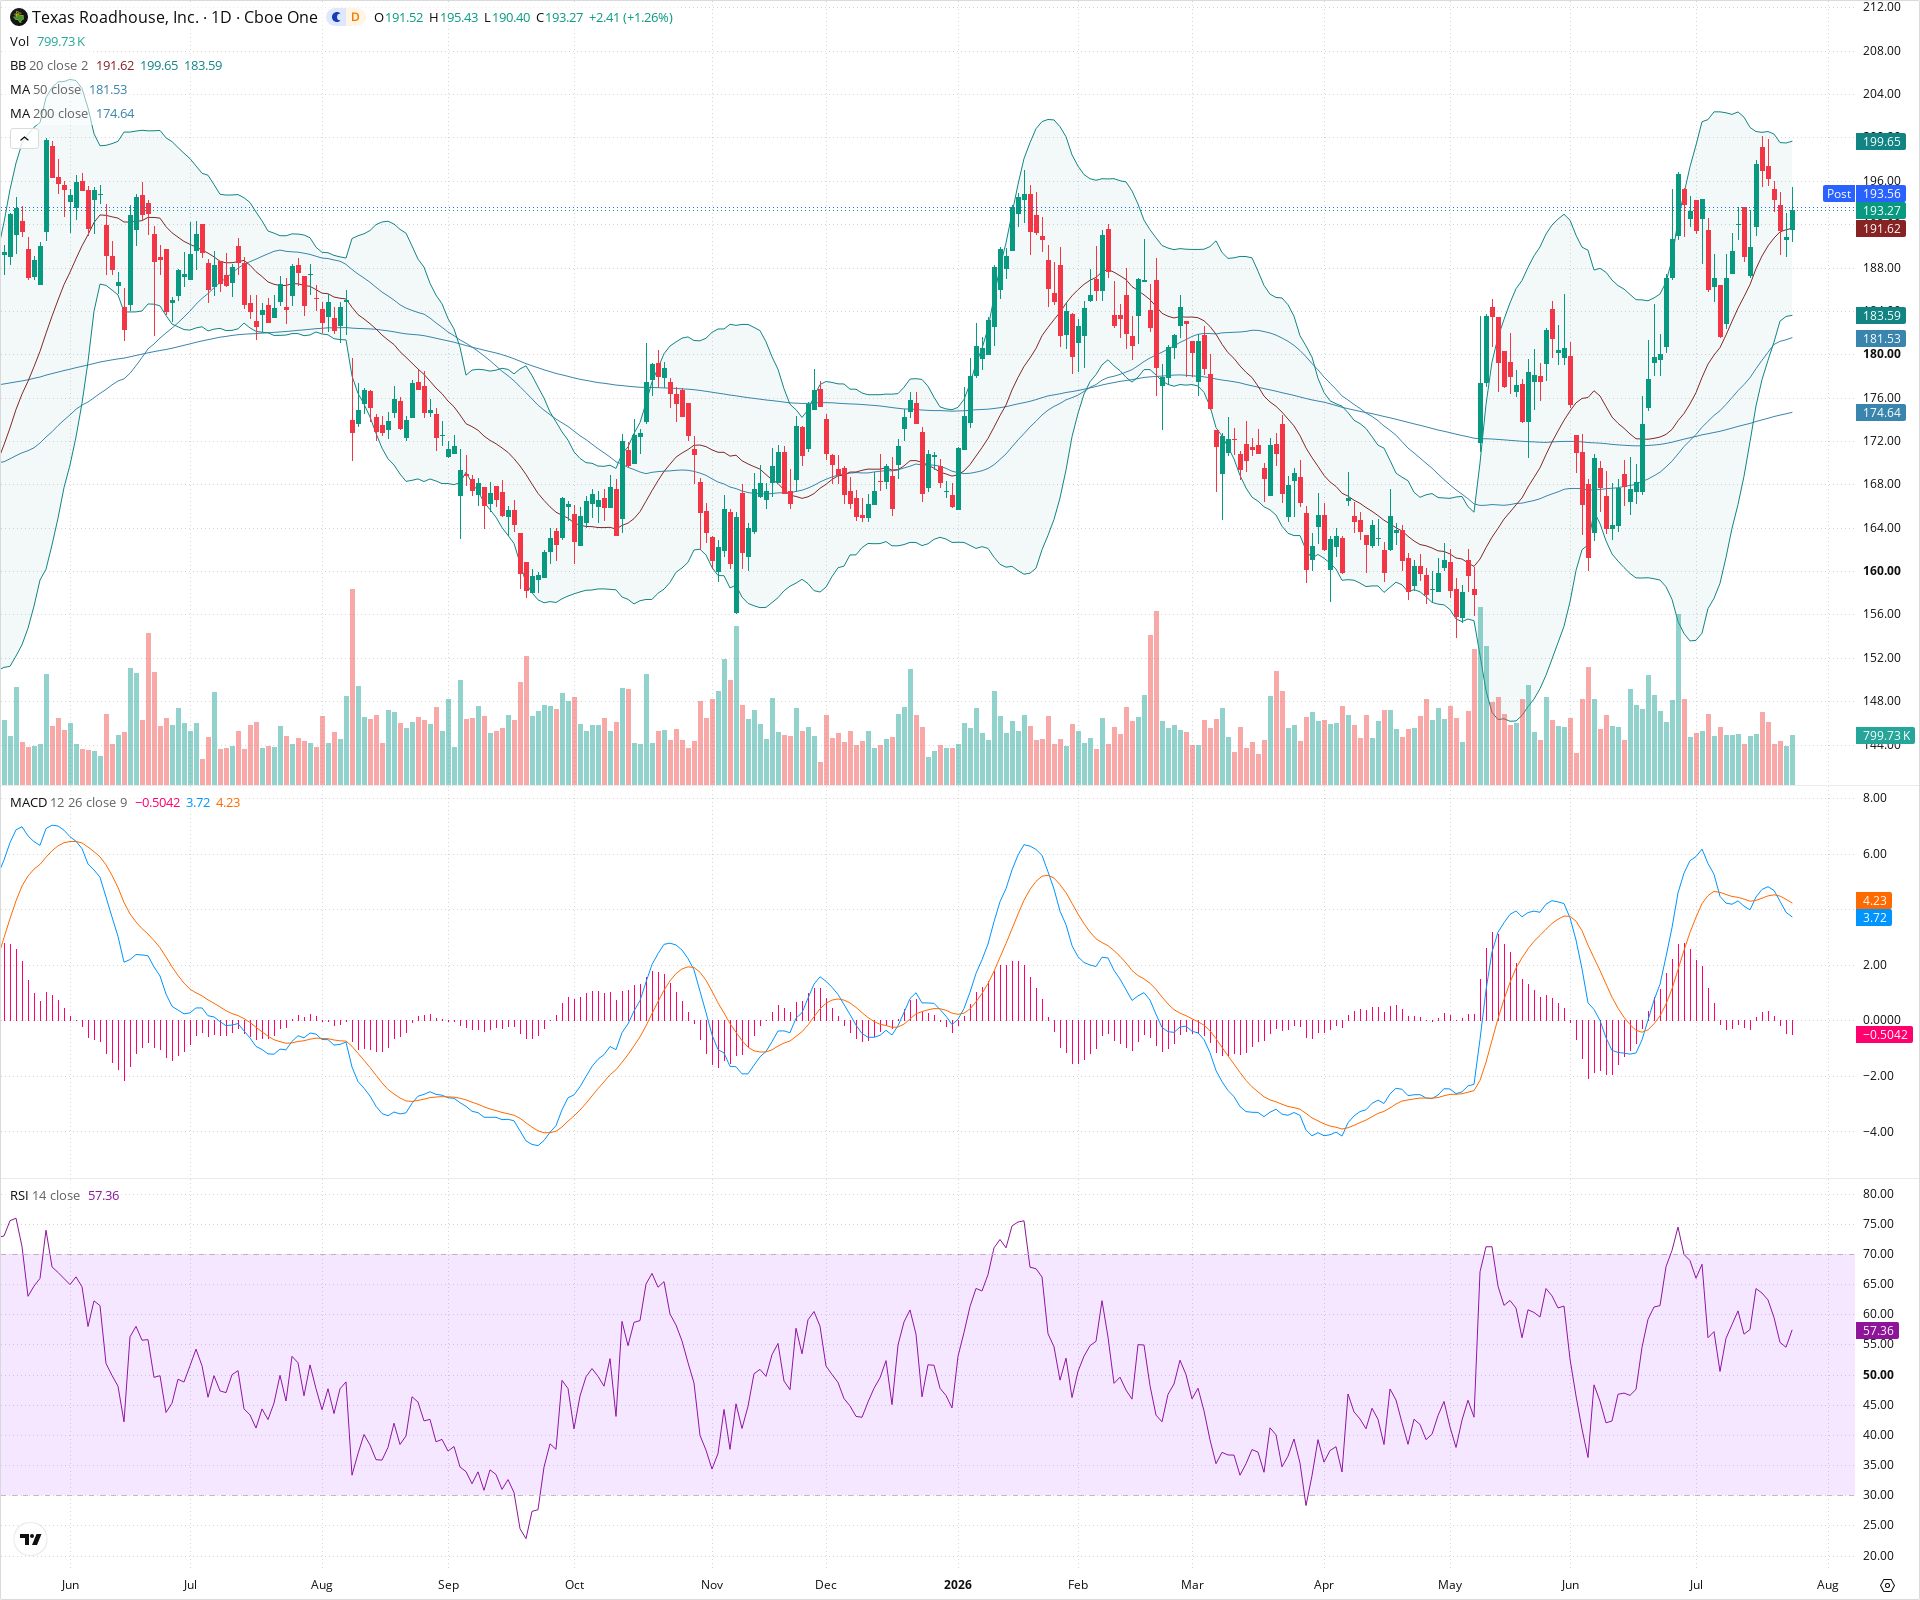
TXRH is in a clear long-term uptrend, trading well above its rising 50-day and 200-day SMAs. In the short term, the stock is taking a breather, consolidating just below recent all-time highs. A breakout above the recent highs could signal a continuation of the trend, while a breakdown below the 50-day SMA might suggest a deeper pullback.
Included In Lists
Related Tickers of Interest
TXRH Daily Chart
Sentiment
Short-term Sentiment (days to weeks): Neutral
Price is currently consolidating after a recent high, moving sideways near the upper Bollinger Band. RSI is in the mid-50s and MACD is flat with a slightly negative histogram, indicating a pause in momentum.
Long-term Sentiment (weeks to months): Bullish
The long-term trend remains upward as indicated by the price being above the rising 200-day and 50-day SMAs. The recent higher high reinforces the bullish long-term structure.
Report Metadata
- Timeframe: daily
- Generated at: 2026-07-24T21:06:33.200Z
- Model: gemini-3.1-pro-preview
Support Price Levels
| Level | Range | Strength | Notes |
|---|---|---|---|
| $182.50 | $181.50 - $183.50 | Strong | Coincides with the 50-day SMA and a recent consolidation area before the last leg up. |
| $173.30 | $172.00 - $174.60 | Strong | Major previous resistance turned support, also aligns with the current position of the 200-day SMA. |
Resistance Price Levels
| Level | Range | Strength | Notes |
|---|---|---|---|
| $197.83 | $196.00 - $199.65 | Strong | Recent all-time high area and the upper Bollinger Band. |
Potential Chart Patterns in Formation
| Strength | Pattern | Signal | Target | Details |
|---|---|---|---|---|
| Weak | Bull Flag / Consolidation | Bullish | N/A | Price is consolidating in a tight range after a strong upward move, forming a potential bull flag near the recent highs. |
Frequently Asked Questions about TXRH
What is the current sentiment for TXRH?
The short-term sentiment for TXRH is currently Neutral because Price is currently consolidating after a recent high, moving sideways near the upper Bollinger Band. RSI is in the mid-50s and MACD is flat with a slightly negative histogram, indicating a pause in momentum.. The long-term trend is classified as Bullish.
What are the key support levels for TXRH?
StockDips.AI has identified key support levels for TXRH at $182.50 and $173.30. These levels may represent potential accumulation zones where buying interest could emerge.
Is TXRH in a significant dip or a Value Dip right now?
TXRH has a Value Score of 30/100. It is not currently flagged as a significant dip in the Top Dips list. It is not listed as a Value Dip because the long-term sentiment or value-score threshold does not qualify.
View the full interactive analysis on StockDips.AI.