KO Daily Technical Analysis
Coca-Cola
World’s largest beverage company (Coke, Sprite, Fanta)
KO Technical Analysis Summary
KO remains in a well-defined long-term uptrend, trading above its rising 200-day moving average. However, the stock is currently undergoing a short-term correction following a rejection at the 87-88 resistance area, forming a double top. The price action is presently testing a critical support zone near the 50-day SMA; a successful hold here could signal continuation of the primary trend, whereas a decisive breakdown may lead to a deeper retracement.
Included In Lists
Related Tickers of Interest
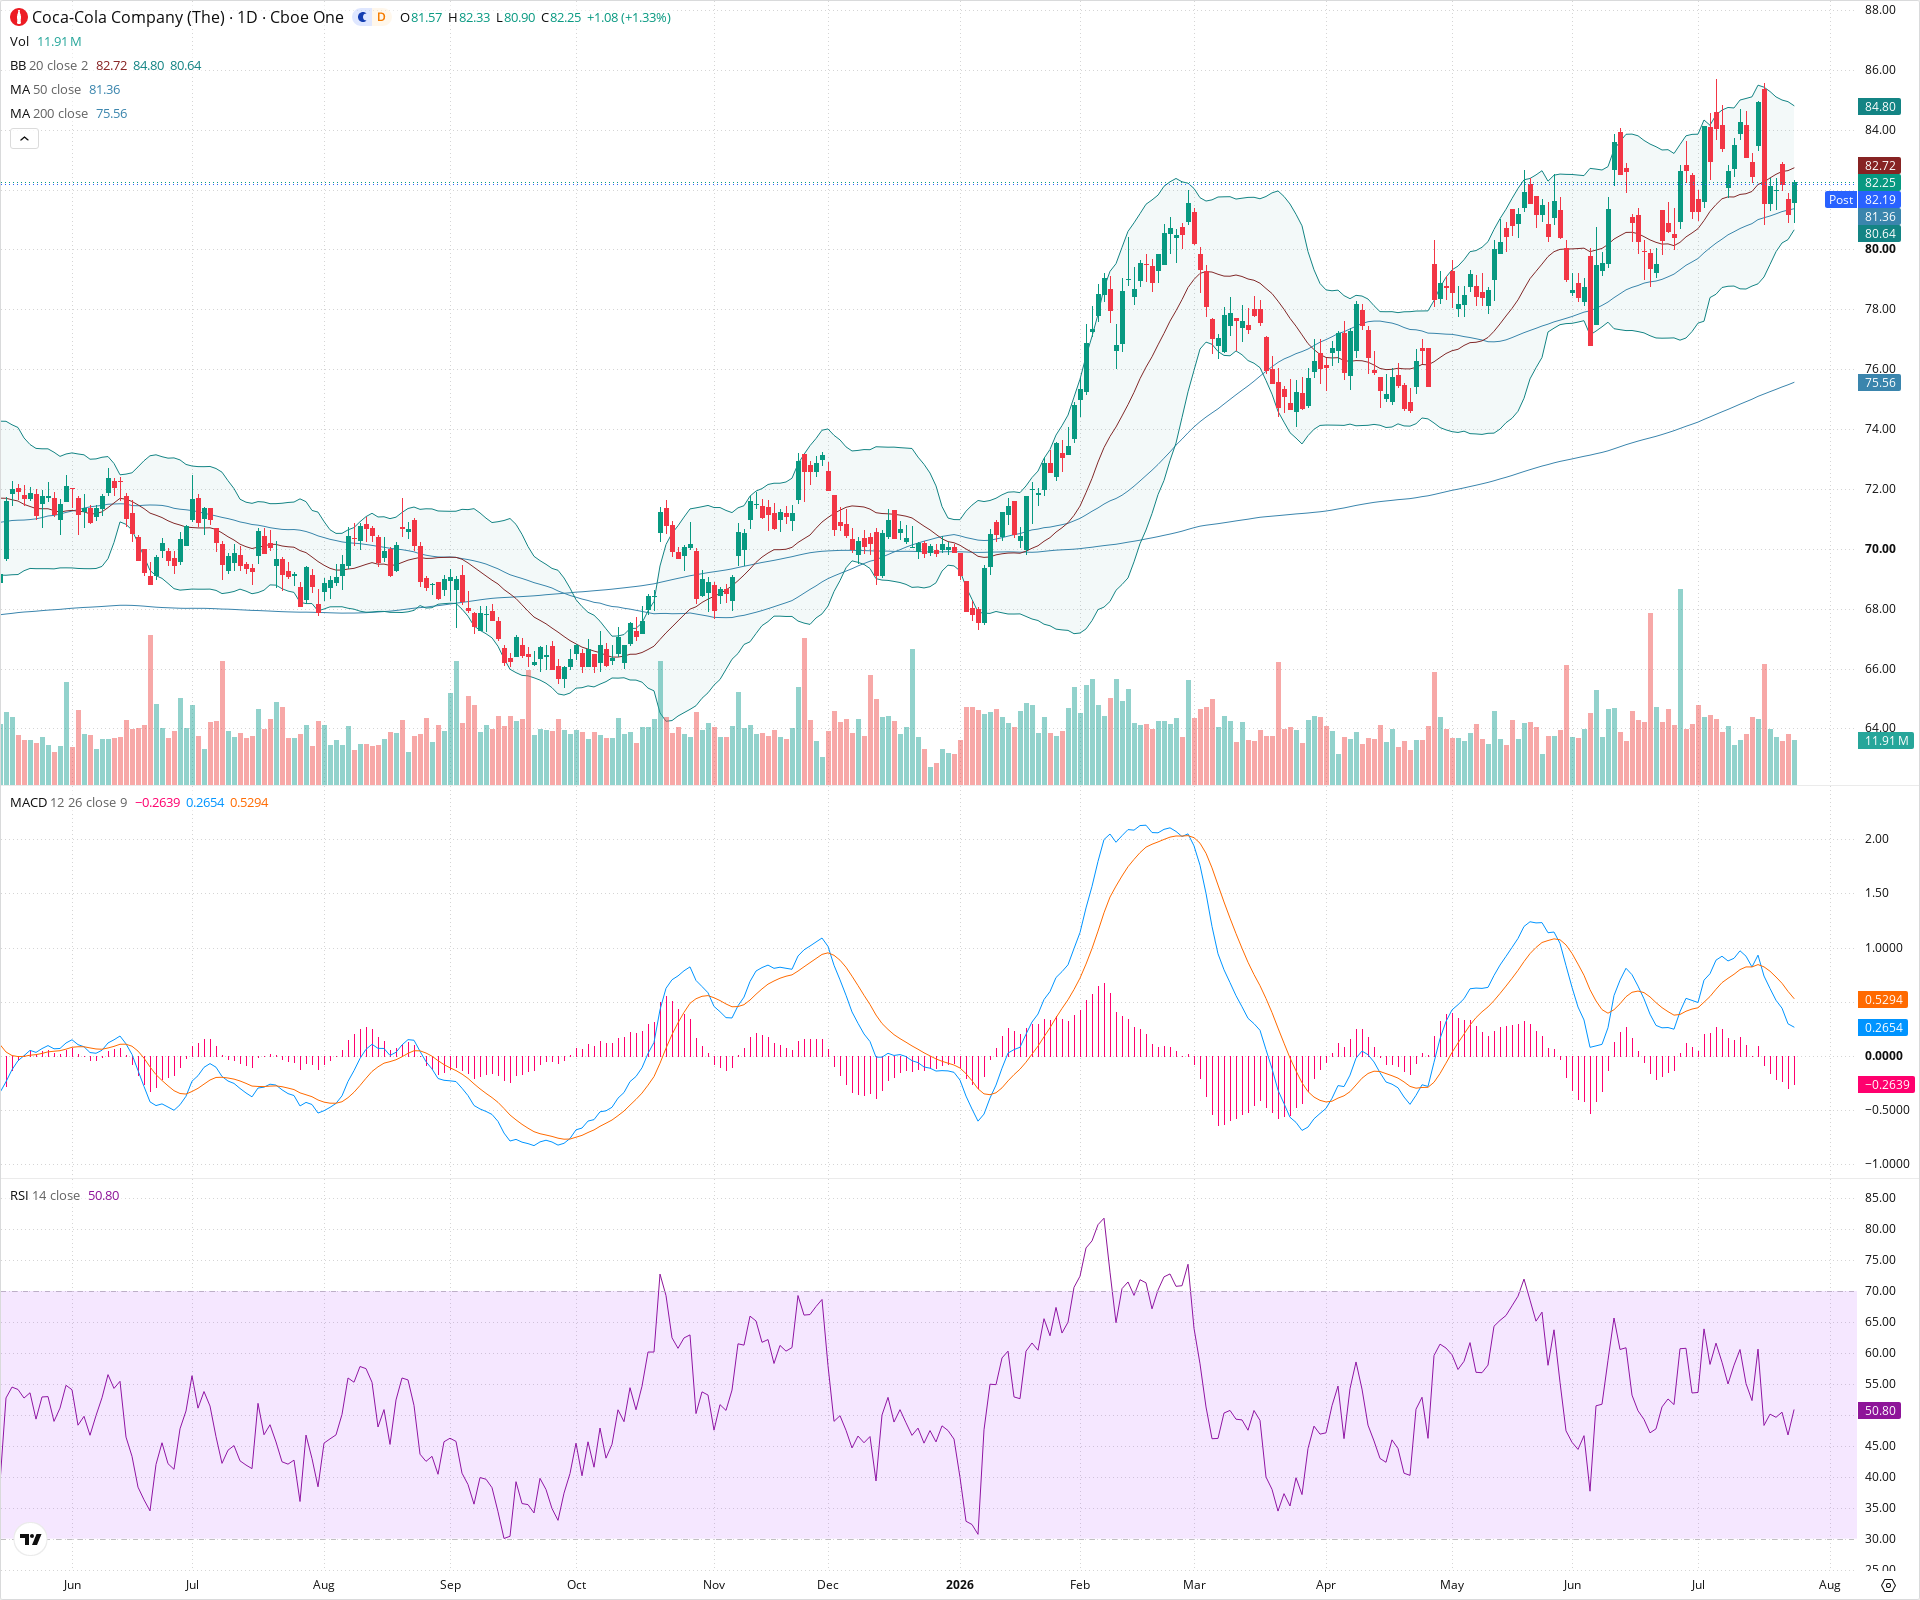
KO Daily Chart
Sentiment
Short-term Sentiment (days to weeks): Neutral
Price has experienced a sharp pullback from recent highs and broke below the 20-day SMA, but is currently finding support near the 50-day SMA. The MACD is in a bearish crossover, but the negative histogram is shrinking, suggesting downward momentum may be slowing.
Long-term Sentiment (weeks to months): Bullish
The long-term trend remains upward, with the price situated well above the rising 200-day SMA. The 50-day SMA is also trending upwards and is positioned above the 200-day SMA, confirming a bullish broader structure.
Report Metadata
- Timeframe: daily
- Generated at: 2026-07-24T21:12:27.699Z
- Model: gemini-3.1-pro-preview
Support Price Levels
| Level | Range | Strength | Notes |
|---|---|---|---|
| $81.00 | $80.50 - $81.50 | Strong | Immediate support zone encompassing the current location of the 50-day SMA and recent swing lows. |
| $77.00 | $76.00 - $78.00 | Strong | Major structural support based on prior consolidation zones and approaching the rising 200-day SMA. |
Resistance Price Levels
| Level | Range | Strength | Notes |
|---|---|---|---|
| $84.75 | $84.00 - $85.50 | Weak | Near-term resistance around the 20-day SMA and the first set of lower highs formed during the recent pullback. |
| $87.50 | $87.00 - $88.00 | Strong | Significant overhead resistance marking the recent cycle highs and forming a potential double top. |
Potential Chart Patterns in Formation
| Strength | Pattern | Signal | Target | Details |
|---|---|---|---|---|
| Strong | Double Top | Bearish | N/A | Price formed two distinct peaks near the 87-88 level before experiencing a sharp decline, indicating strong resistance and a potential trend reversal or significant correction. |
Frequently Asked Questions about KO
What is the current sentiment for KO?
The short-term sentiment for KO is currently Neutral because Price has experienced a sharp pullback from recent highs and broke below the 20-day SMA, but is currently finding support near the 50-day SMA. The MACD is in a bearish crossover, but the negative histogram is shrinking, suggesting downward momentum may be slowing.. The long-term trend is classified as Bullish.
What are the key support levels for KO?
StockDips.AI has identified key support levels for KO at $81.00 and $77.00. These levels may represent potential accumulation zones where buying interest could emerge.
Is KO in a significant dip or a Value Dip right now?
KO has a Value Score of 67/100. It is not currently flagged as a significant dip in the Top Dips list. It is not listed as a Value Dip because the long-term sentiment or value-score threshold does not qualify.
View the full interactive analysis on StockDips.AI.