PEP Daily Technical Analysis
PepsiCo
Global food & beverage giant (Pepsi, Gatorade, Lays, Doritos)
PEP Technical Analysis Summary
PEP remains entrenched in a strong long-term downtrend, trading heavily below its 50-day and 200-day moving averages. While short-term indicators like an upticking RSI and shrinking MACD histogram suggest a minor relief rally is underway, structural damage is significant. Any upside is likely to face stiff resistance at nearby moving averages, and the primary technical bias remains in favor of sellers until a higher high is established.
Included In Lists
Related Tickers of Interest
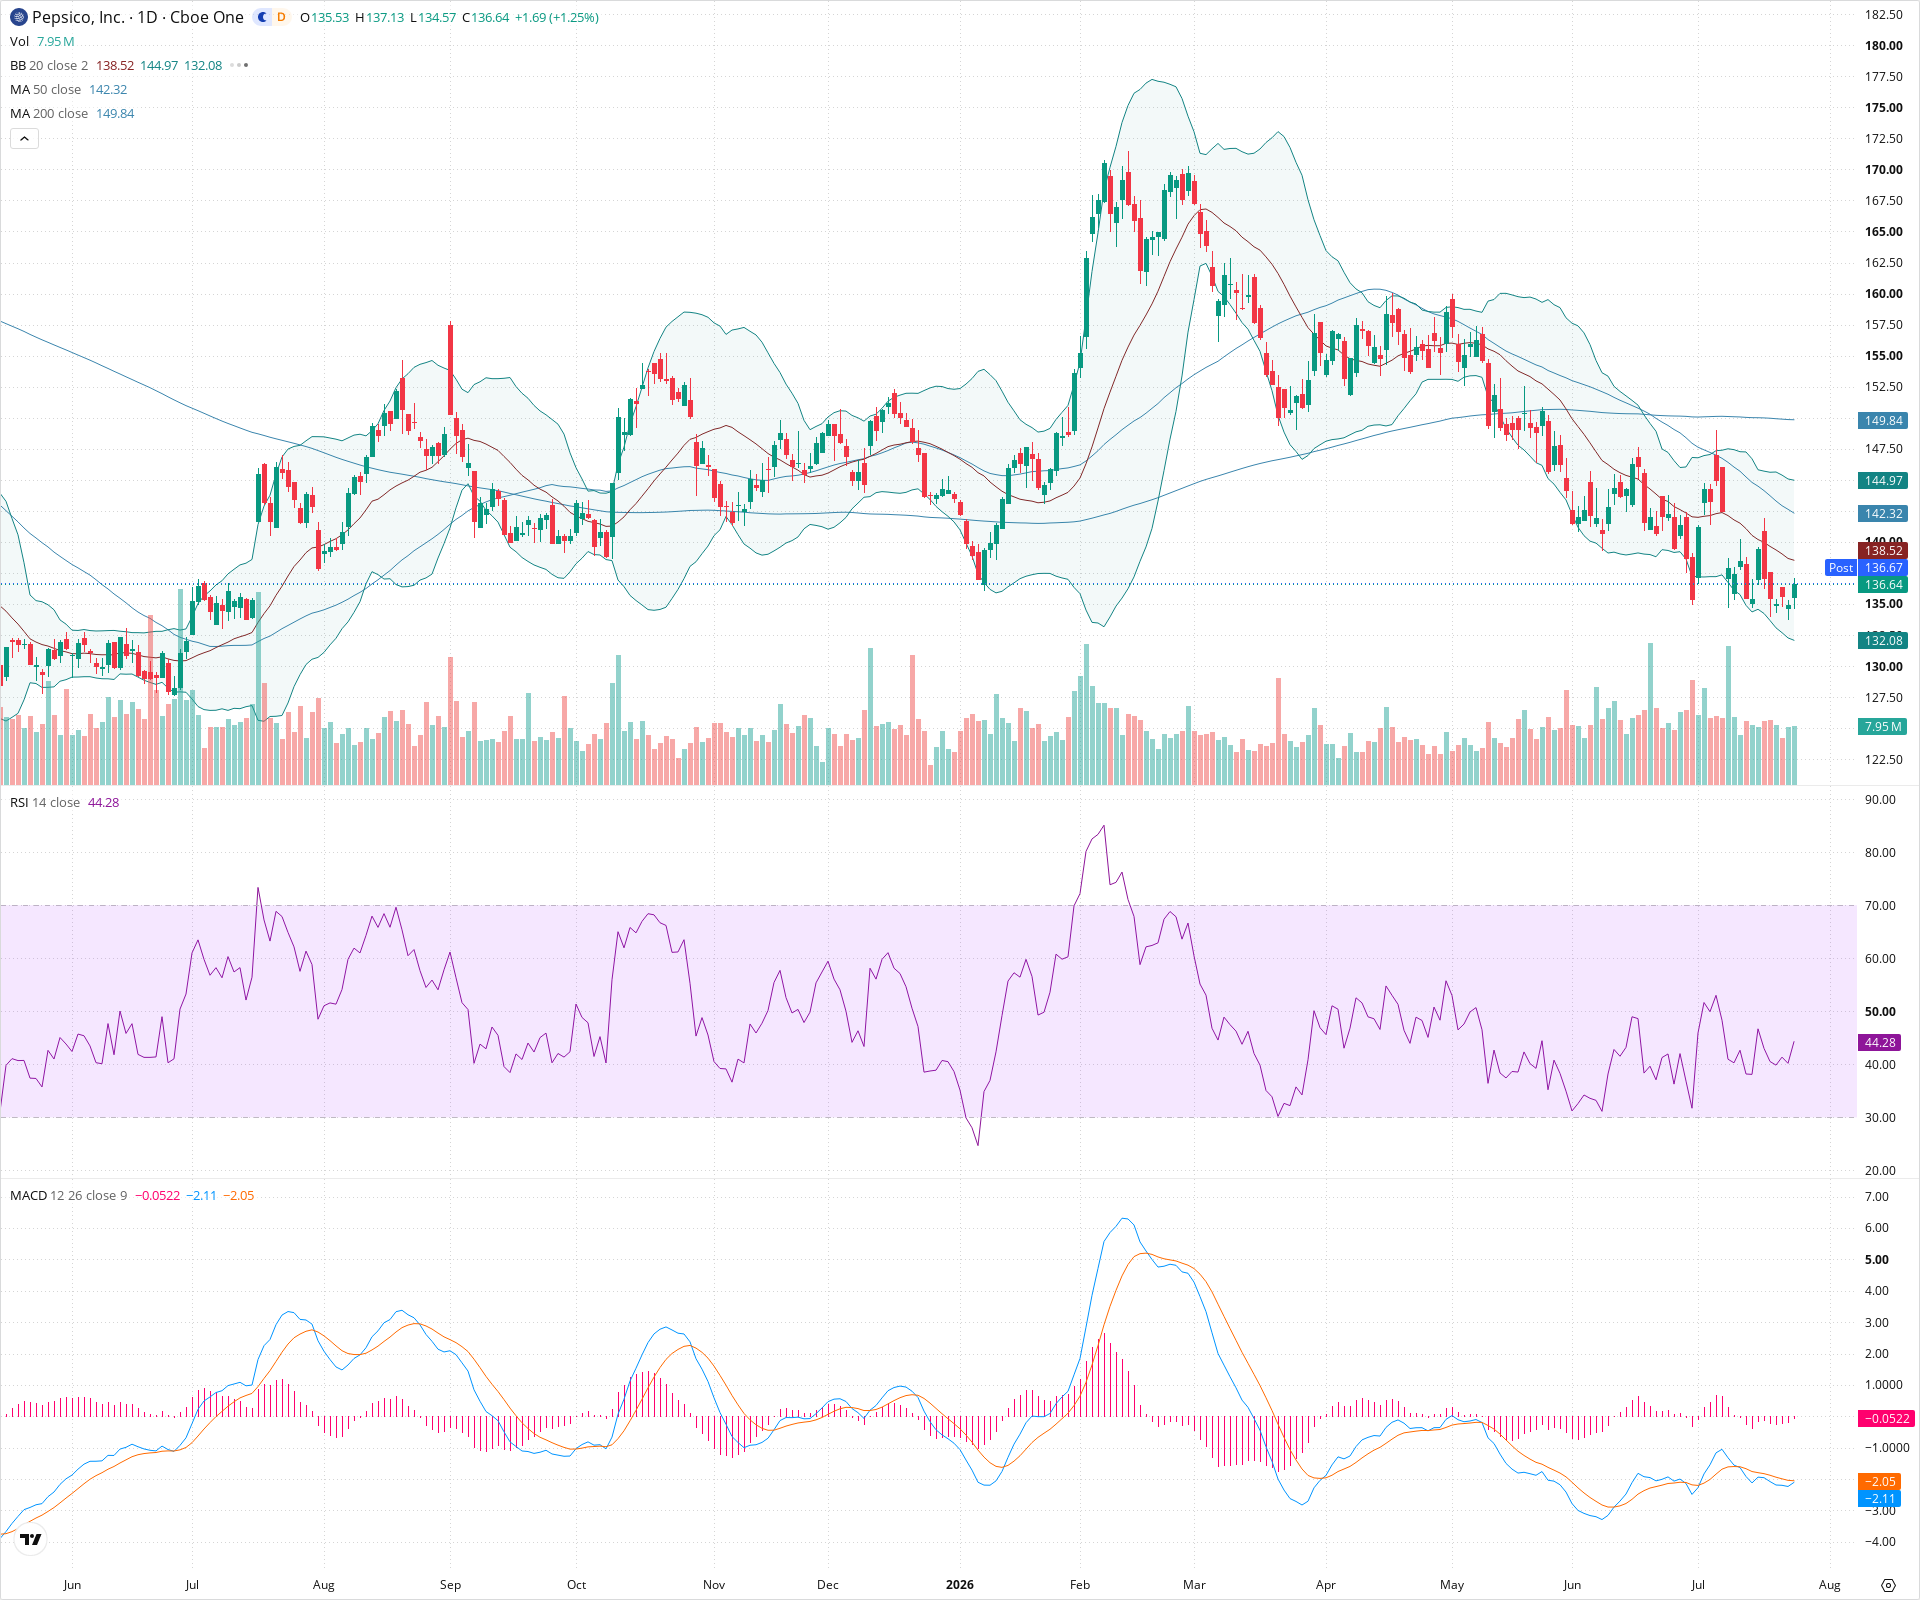
PEP Daily Chart
Sentiment
Short-term Sentiment (days to weeks): Neutral
Price is attempting a short-term bounce from the lower Bollinger Band, supported by RSI ticking up from near-oversold levels and waning negative momentum on the MACD histogram. However, it remains below the declining 20-day SMA.
Long-term Sentiment (weeks to months): Bearish
The stock is in a clear, sustained downtrend, characterized by a series of lower highs and lower lows. Price is trading well below both the sharply declining 50-day and 200-day simple moving averages.
Report Metadata
- Timeframe: daily
- Generated at: 2026-07-24T21:12:20.700Z
- Model: gemini-3.1-pro-preview
Support Price Levels
| Level | Range | Strength | Notes |
|---|---|---|---|
| $135.25 | $134.50 - $136.00 | Weak | Recent swing low and origin of the current minor bounce. |
| $131.25 | $130.00 - $132.50 | Moderate | Historical consolidation zone visible on the far left of the chart. |
Resistance Price Levels
| Level | Range | Strength | Notes |
|---|---|---|---|
| $139.25 | $138.50 - $140.00 | Moderate | Initial resistance zone comprising the descending 20-day SMA and recent minor reaction highs. |
| $143.50 | $142.00 - $145.00 | Strong | Major resistance cluster including the declining 50-day SMA and a previous consolidation/breakdown level. |
Potential Chart Patterns in Formation
| Strength | Pattern | Signal | Target | Details |
|---|---|---|---|---|
| Strong | Downtrend Structure | Bearish | N/A | A persistent pattern of lower highs and lower lows below all major moving averages since the peak near 175. |
| Weak | Oversold Bounce | Bullish | $138.50 | Price is currently experiencing a counter-trend reaction after touching the lower Bollinger Band, with RSI hooking up. |
Frequently Asked Questions about PEP
What is the current sentiment for PEP?
The short-term sentiment for PEP is currently Neutral because Price is attempting a short-term bounce from the lower Bollinger Band, supported by RSI ticking up from near-oversold levels and waning negative momentum on the MACD histogram. However, it remains below the declining 20-day SMA.. The long-term trend is classified as Bearish.
What are the key support levels for PEP?
StockDips.AI has identified key support levels for PEP at $135.25 and $131.25. These levels may represent potential accumulation zones where buying interest could emerge.
Is PEP in a significant dip or a Value Dip right now?
PEP has a Value Score of 65/100. It is not currently flagged as a significant dip in the Top Dips list. It is not listed as a Value Dip because the long-term sentiment or value-score threshold does not qualify.
View the full interactive analysis on StockDips.AI.