SBUX Daily Technical Analysis
Starbucks Corporation
Global coffeehouse chain offering beverages, food, and packaged goods through more than 35,000 locations worldwide.
SBUX Technical Analysis Summary
SBUX remains in a constructive long-term technical position, defined by a rising 50-day moving average situated above a rising 200-day moving average. However, the stock is currently undergoing a broad consolidation phase following its May peak. Immediate focus is on the 50-day SMA support zone near current prices; short-term momentum indicators like the MACD and RSI are leaning bearish, suggesting this support may be tested. A decisive hold here could lead to another attempt at recent highs, while a breakdown may invite a deeper pullback toward the high-90s support levels.
Included In Lists
Related Tickers of Interest
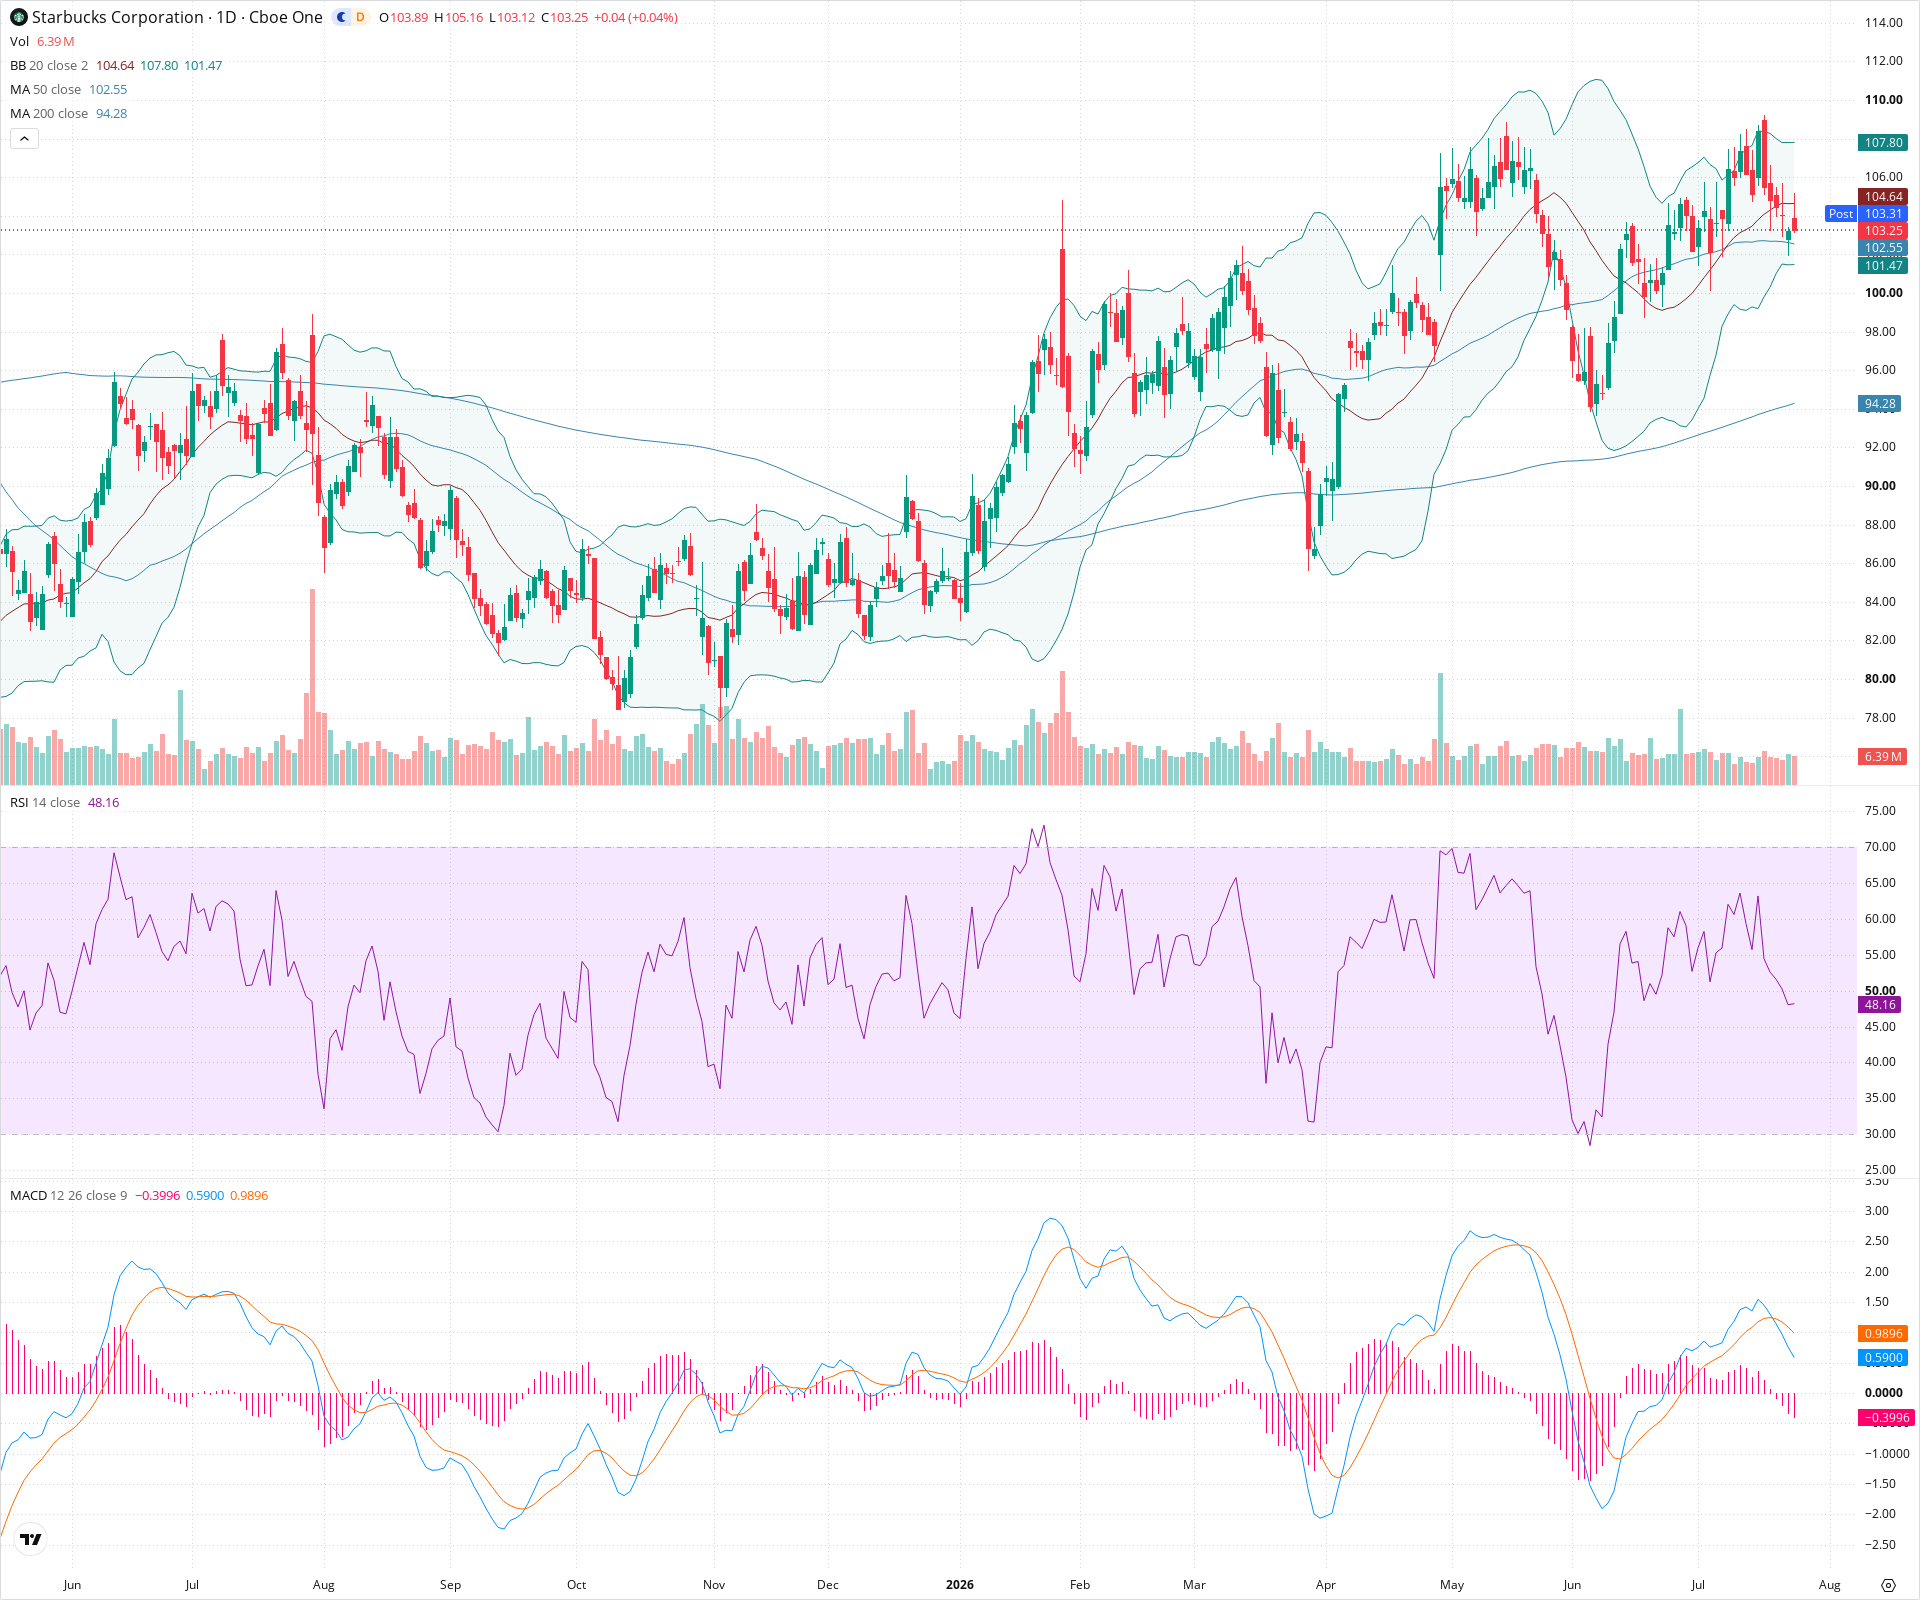
SBUX Daily Chart
Sentiment
Short-term Sentiment (days to weeks): Neutral
Price is currently testing key support at the 50-day SMA after a recent pullback from a lower high. While momentum indicators (RSI dropping below 50, bearish MACD crossover) suggest downward pressure, the adherence to this support level indicates short-term indecision.
Long-term Sentiment (weeks to months): Bullish
The broader trend remains upward, supported by the 50-day SMA being positioned significantly above the 200-day SMA, and the price maintaining levels well above the 200-day SMA since late last year.
Report Metadata
- Timeframe: daily
- Generated at: 2026-07-24T21:17:00.801Z
- Model: gemini-3.1-pro-preview
Support Price Levels
| Level | Range | Strength | Notes |
|---|---|---|---|
| $102.25 | $101.50 - $103.00 | Strong | Confluence zone of the current 50-day SMA (102.55) and the middle Bollinger Band. |
| $98.25 | $97.50 - $99.00 | Strong | Recent swing higher-low established in early July. |
| $94.25 | $93.50 - $95.00 | Strong | Major swing low from early June, closely aligning with the current 200-day SMA (94.28). |
Resistance Price Levels
| Level | Range | Strength | Notes |
|---|---|---|---|
| $107.75 | $107.00 - $108.50 | Strong | Recent swing high established in late July where price momentum stalled. |
| $110.25 | $109.50 - $111.00 | Strong | Major peak and highest point on the visible chart, established in May. |
Potential Chart Patterns in Formation
| Strength | Pattern | Signal | Target | Details |
|---|---|---|---|---|
| Moderate | Lower High Structure | Bearish | N/A | The recent peak near 108 is visibly lower than the preceding major peak near 110, suggesting a potential stalling of the longer-term upward momentum. |
| Strong | Broad Consolidation | Neutral | N/A | Since reaching highs in May, the price has entered a wide, choppy consolidation phase roughly between 94 and 110, digesting previous gains. |
Frequently Asked Questions about SBUX
What is the current sentiment for SBUX?
The short-term sentiment for SBUX is currently Neutral because Price is currently testing key support at the 50-day SMA after a recent pullback from a lower high. While momentum indicators (RSI dropping below 50, bearish MACD crossover) suggest downward pressure, the adherence to this support level indicates short-term indecision.. The long-term trend is classified as Bullish.
What are the key support levels for SBUX?
StockDips.AI has identified key support levels for SBUX at $102.25 and $98.25. These levels may represent potential accumulation zones where buying interest could emerge.
Is SBUX in a significant dip or a Value Dip right now?
SBUX has a Value Score of 82/100. It is currently flagged as a significant dip in the Top Dips list. It is also listed as a Value Dip because long-term sentiment is bullish.
View the full interactive analysis on StockDips.AI.