CPER Weekly Technical Analysis
United States Copper Index Fund
Provides exposure to copper futures prices. Copper is a critical industrial metal used in construction, manufacturing, renewable energy, and electric vehicles. Often called “Dr. Copper” due to its ability to signal global economic strength or weakness.
CPER Technical Analysis Summary
The technical posture for this asset on a weekly basis is strongly bullish long-term, driven by a definitive breakout from a multi-year base. While the primary trend is robustly supported by rising moving averages, short-term momentum indicators suggest the current consolidation phase may continue as the asset digests recent gains before attempting to break above the near-term resistance at $41.
Included In Lists
Related Tickers of Interest
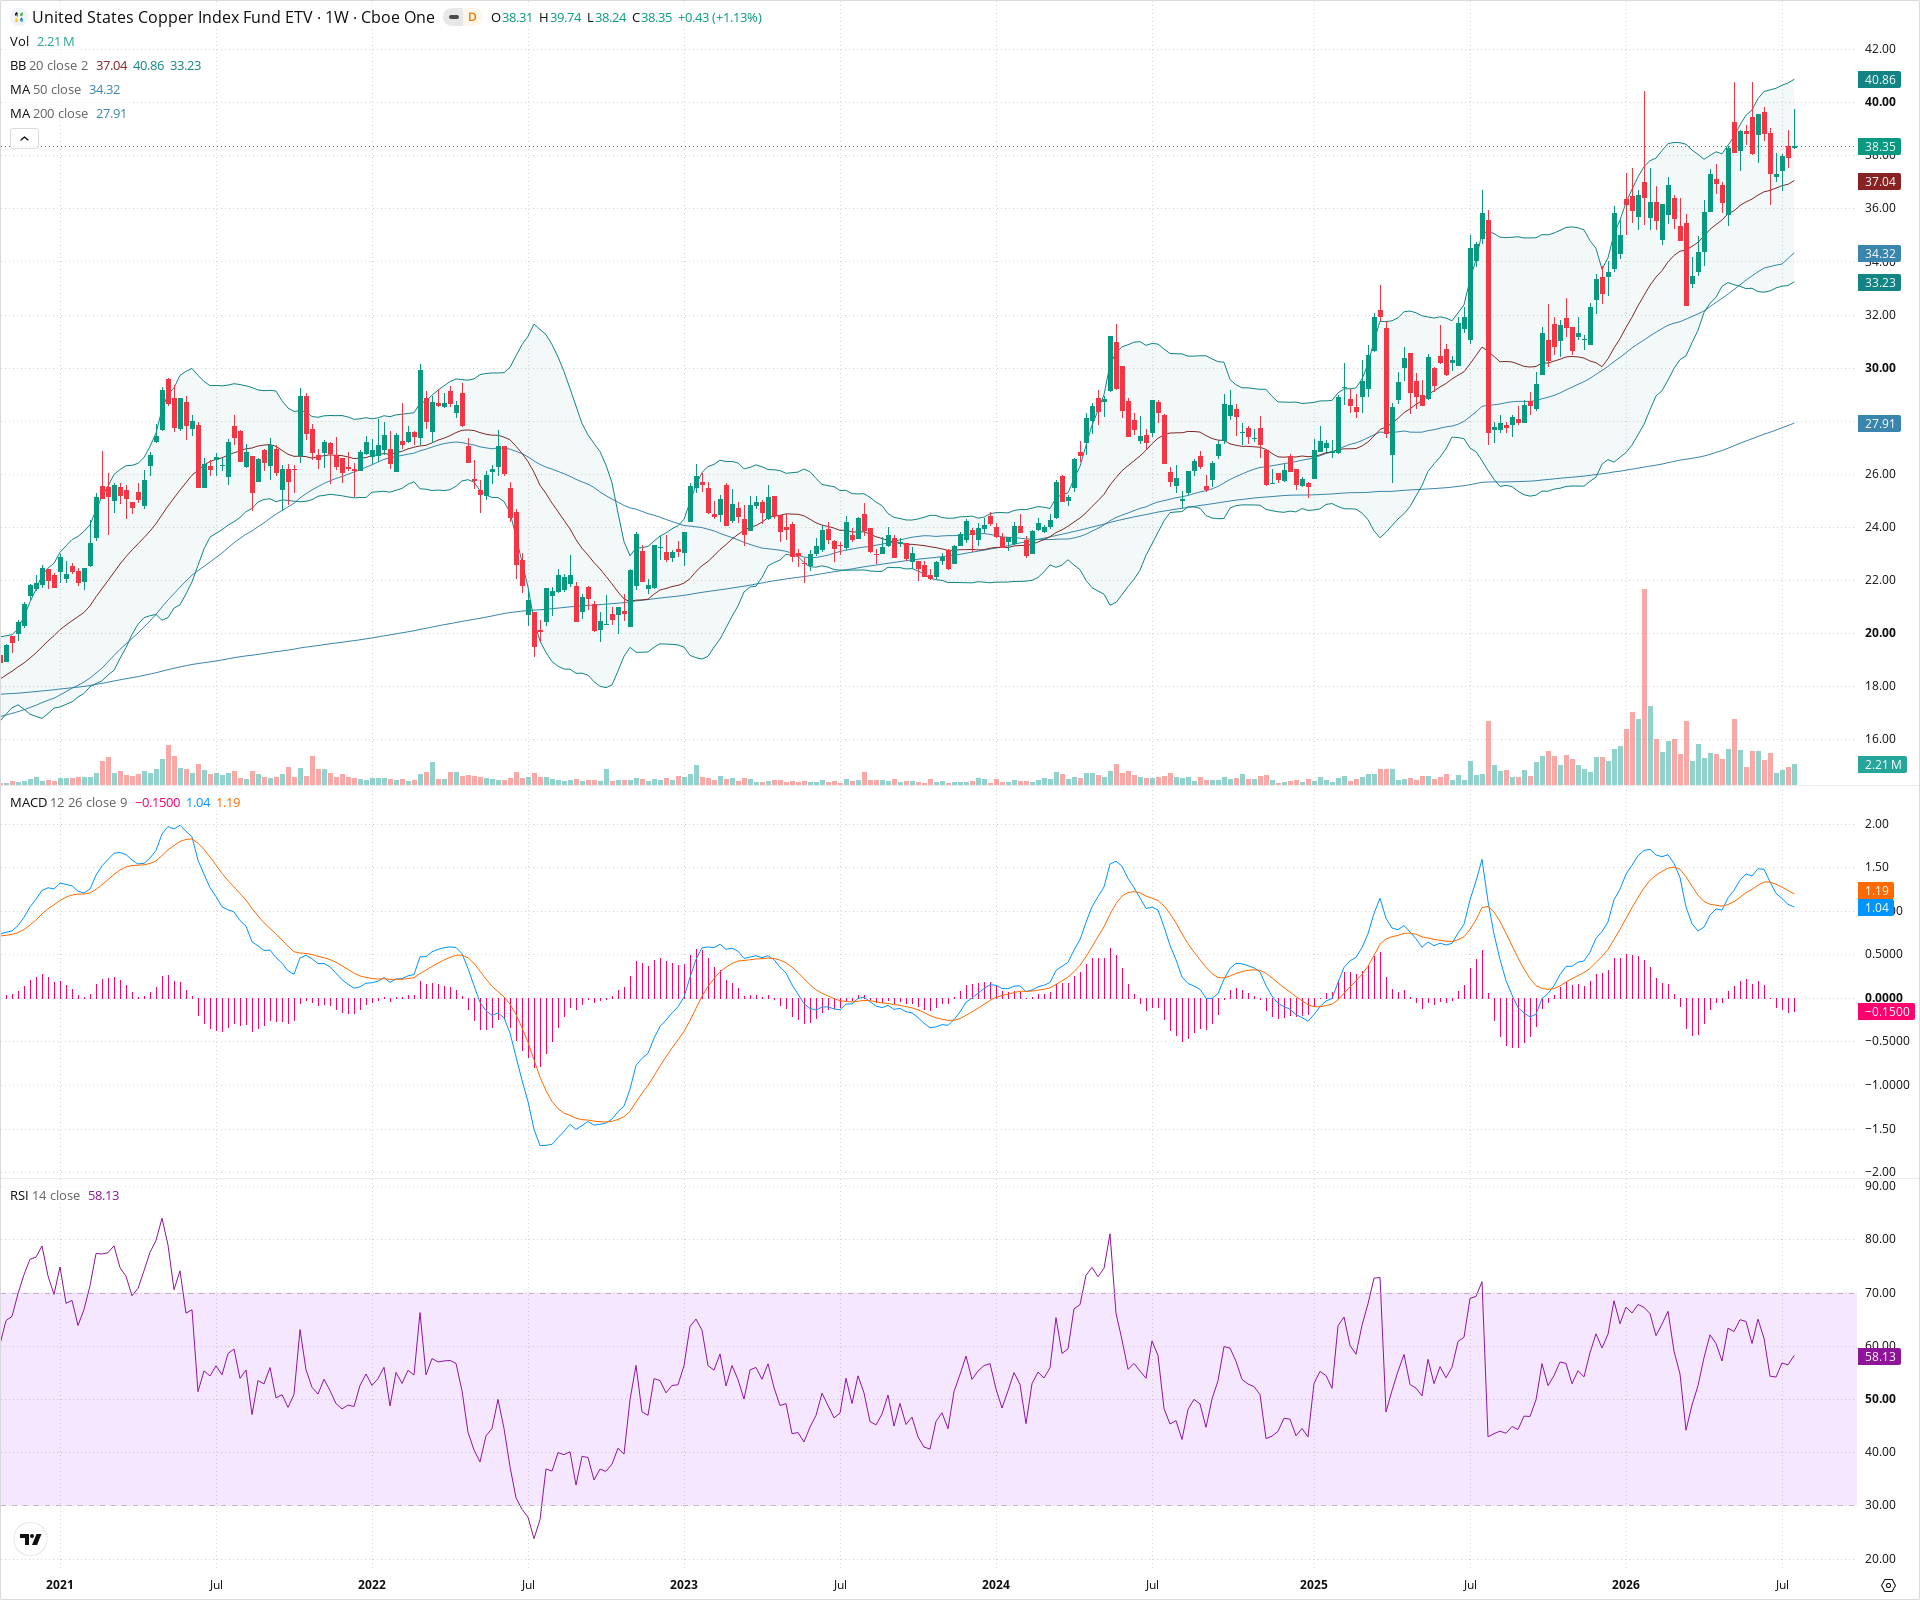
CPER Weekly Chart
Sentiment
Short-term Sentiment (days to weeks): Neutral
Short-term momentum has stalled as the price consolidates below recent highs, accompanied by a negative MACD histogram and declining RSI, though it remains well above the 50-week SMA.
Long-term Sentiment (weeks to months): Bullish
The chart exhibits a strong structural uptrend of higher highs and higher lows following a major multi-year base breakout, with price trending well above the rising 50-week and 200-week SMAs.
Report Metadata
- Timeframe: weekly
- Generated at: 2026-07-25T09:12:42.599Z
- Model: gemini-3.1-pro-preview
Support Price Levels
| Level | Range | Strength | Notes |
|---|---|---|---|
| $35.00 | $34.00 - $36.00 | Strong | Confluence of the rising 50-week SMA and the upper boundary of a previous consolidation zone. |
| $30.00 | $29.00 - $31.00 | Strong | Major multi-year structural resistance level that was clearly broken and should now act as long-term support. |
| $27.75 | $27.00 - $28.50 | Weak | Zone surrounding the rising 200-week SMA. |
Resistance Price Levels
| Level | Range | Strength | Notes |
|---|---|---|---|
| $40.75 | $40.00 - $41.50 | Strong | Recent major swing high acting as immediate overhead resistance. |
Potential Chart Patterns in Formation
| Strength | Pattern | Signal | Target | Details |
|---|---|---|---|---|
| Strong | Multi-year Base Breakout | Bullish | N/A | Price broke powerfully out of a roughly 3-year consolidation base above the $30 level in early 2024, signaling a major long-term trend shift. |
| Moderate | Bullish Consolidation | Bullish | N/A | The current sideways-to-downward price action appears to be a healthy consolidation following a steep run-up, potentially setting up for continuation. |
Frequently Asked Questions about CPER
What is the current sentiment for CPER?
The short-term sentiment for CPER is currently Neutral because Short-term momentum has stalled as the price consolidates below recent highs, accompanied by a negative MACD histogram and declining RSI, though it remains well above the 50-week SMA.. The long-term trend is classified as Bullish.
What are the key support levels for CPER?
StockDips.AI has identified key support levels for CPER at $35.00 and $30.00. These levels may represent potential accumulation zones where buying interest could emerge.
Is CPER in a significant dip or a Value Dip right now?
CPER has a Value Score of 51/100. It is not currently flagged as a significant dip in the Top Dips list. It is not listed as a Value Dip because the long-term sentiment or value-score threshold does not qualify.
View the full interactive analysis on StockDips.AI.