USO Daily Technical Analysis
United States Oil Fund
Designed to track the daily price movements of West Texas Intermediate (WTI) crude oil using futures contracts. Oil prices are driven by global supply and demand, OPEC policy, geopolitics, and economic growth expectations.
USO Technical Analysis Summary
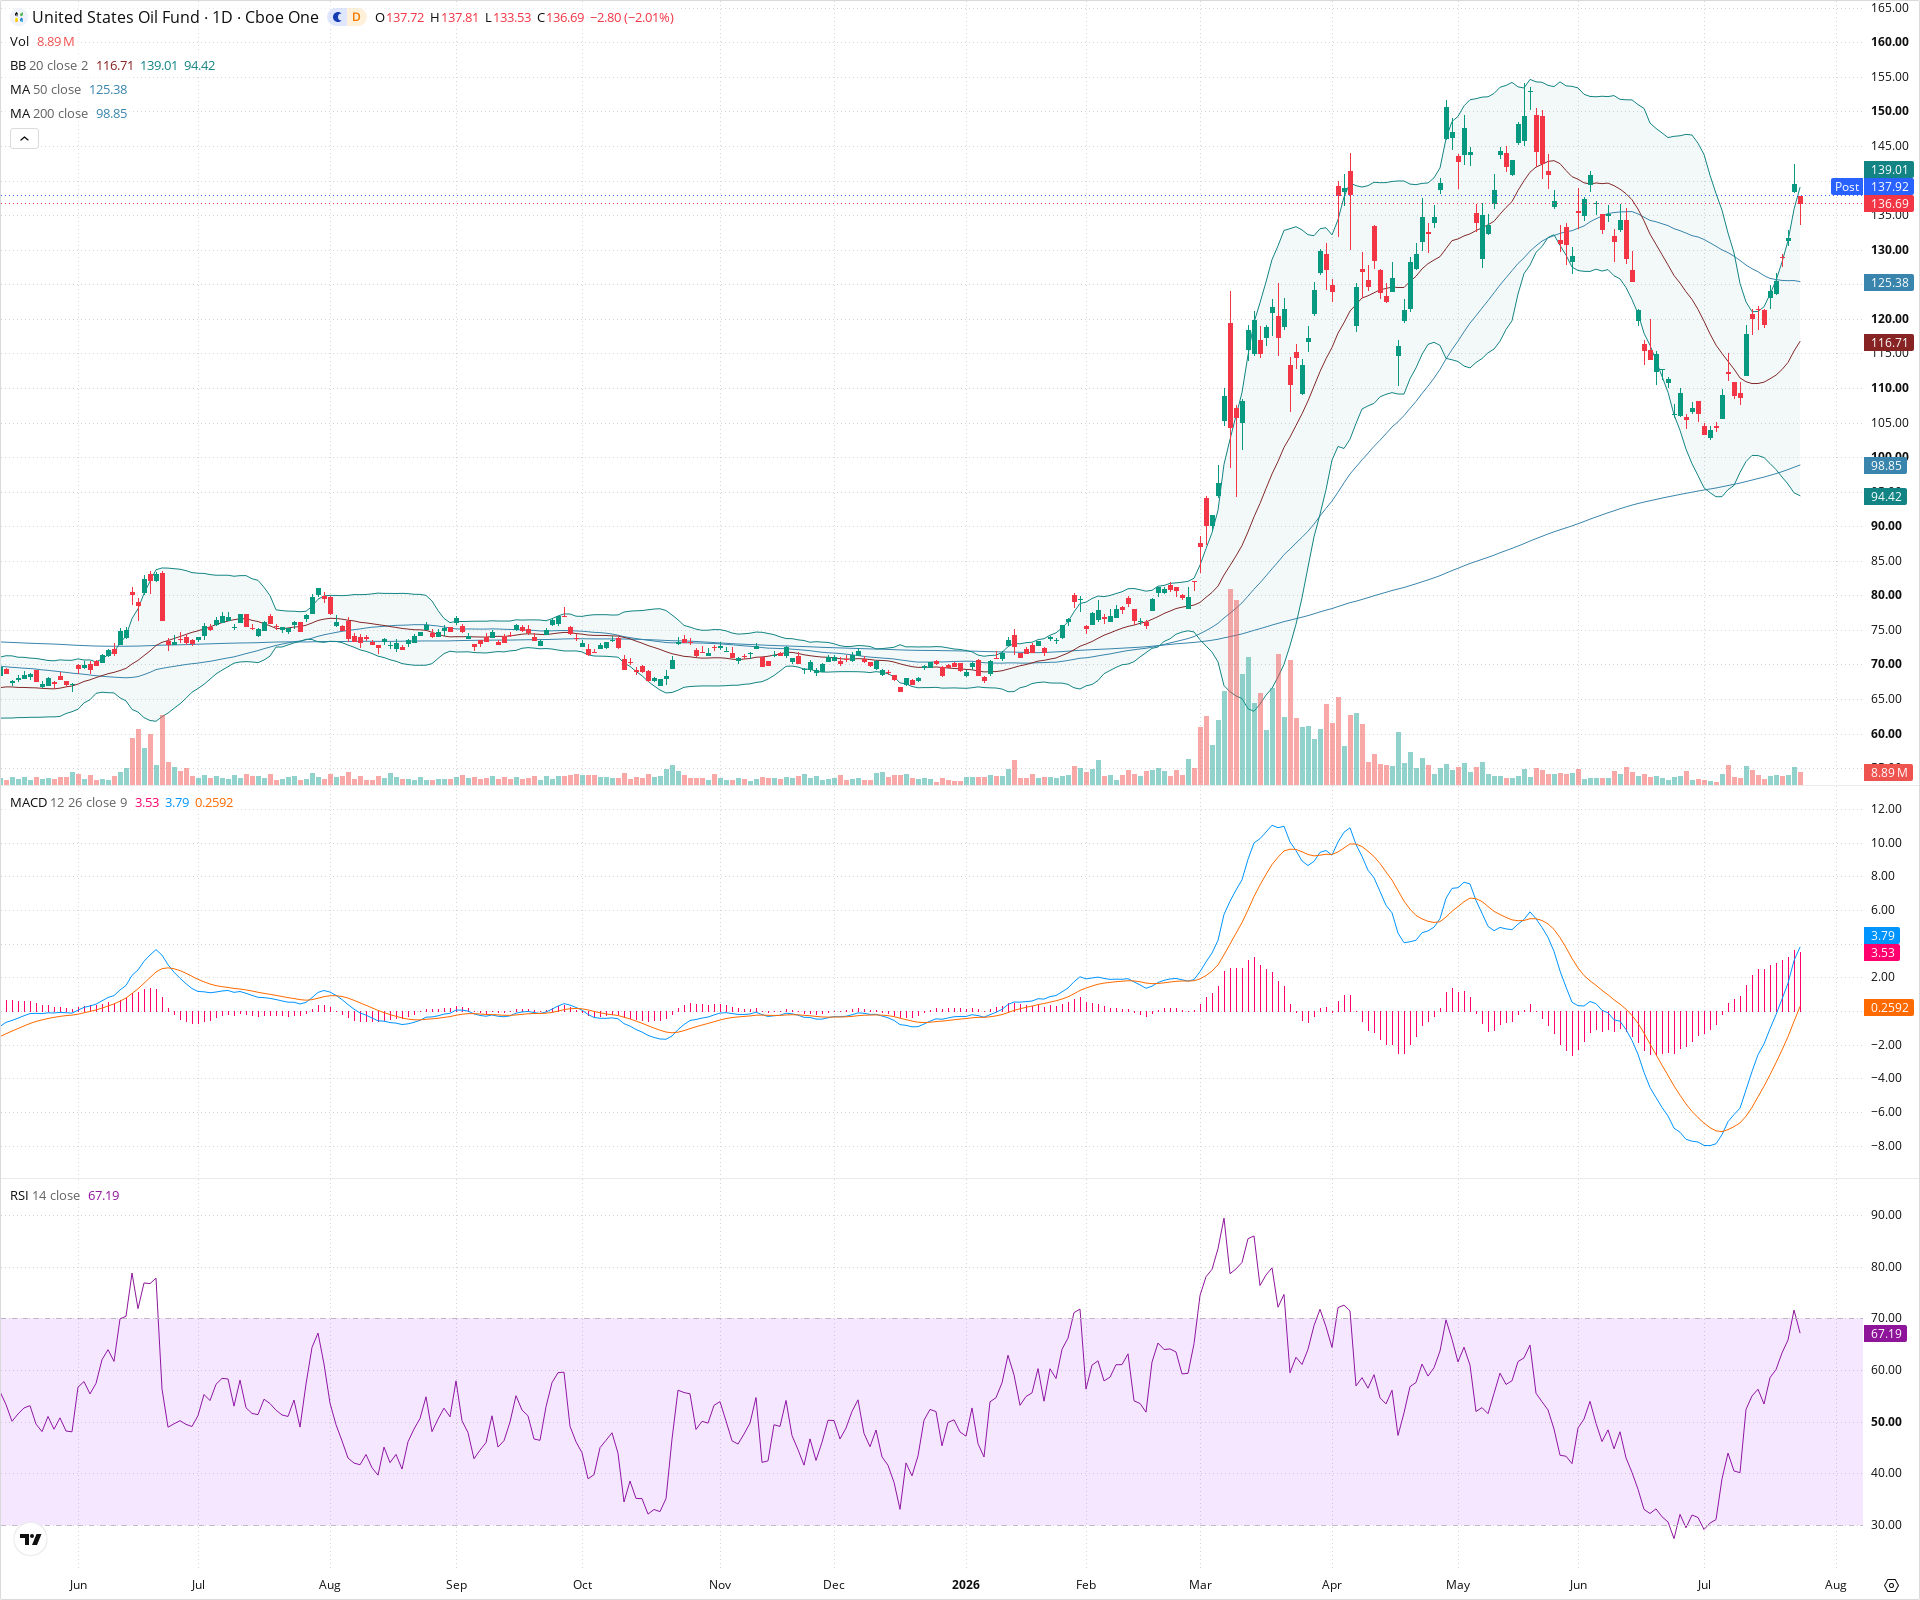
USO remains in a dominant long-term uptrend, clearly visible by its sustained position above rising 50-day and 200-day moving averages. Following a deep, sharp correction to the 105 area, the asset has staged an impressive V-shaped recovery, backed by a bullish MACD crossover and strong RSI momentum. While short-term consolidation around the 140 resistance level is possible, the broader technical picture suggests continued upside potential for long-term investors, with 125 acting as an initial support zone on any further pullbacks.
Included In Lists
Related Tickers of Interest
USO Daily Chart
Sentiment
Short-term Sentiment (days to weeks): Bullish
Price is exhibiting a strong V-shaped recovery from the ~105 low, supported by a bullish MACD crossover with rising positive histogram momentum and an RSI that has surged from oversold towards the bullish 70 zone. The current red candle appears to be a minor consolidation after a rapid ascent.
Long-term Sentiment (weeks to months): Bullish
The long-term market structure remains a strong uptrend. The price is well above both the rising 50-day and 200-day SMAs. The recent deep correction found support and sharply reversed, suggesting the underlying secular bull trend remains intact.
Report Metadata
- Timeframe: daily
- Generated at: 2026-07-24T21:15:48.500Z
- Model: gemini-3.1-pro-preview
Support Price Levels
| Level | Range | Strength | Notes |
|---|---|---|---|
| $125.00 | $124.00 - $126.00 | Weak | Dynamic support area near the rising 50-day SMA. |
| $107.50 | $105.00 - $110.00 | Strong | Recent major swing low and origin of the current strong reversal; represents significant buyer interest. |
| $99.00 | $98.00 - $100.00 | Strong | Psychological round number support zone aligning closely with the rising 200-day SMA. |
Resistance Price Levels
| Level | Range | Strength | Notes |
|---|---|---|---|
| $140.00 | $139.00 - $141.00 | Weak | Immediate local resistance based on the most recent swing high just prior to the current minor pullback. |
| $157.50 | $155.00 - $160.00 | Strong | The major swing high / peak visible on the chart; a significant historical supply zone. |
Potential Chart Patterns in Formation
| Strength | Pattern | Signal | Target | Details |
|---|---|---|---|---|
| Strong | V-Shaped Recovery | Bullish | N/A | A very sharp, aggressive bounce from the oversold low near 105, quickly reclaiming significant lost ground and breaking back above short-term moving averages. |
Frequently Asked Questions about USO
What is the current sentiment for USO?
The short-term sentiment for USO is currently Bullish because Price is exhibiting a strong V-shaped recovery from the ~105 low, supported by a bullish MACD crossover with rising positive histogram momentum and an RSI that has surged from oversold towards the bullish 70 zone. The current red candle appears to be a minor consolidation after a rapid ascent.. The long-term trend is classified as Bullish.
What are the key support levels for USO?
StockDips.AI has identified key support levels for USO at $125.00 and $107.50. These levels may represent potential accumulation zones where buying interest could emerge.
Is USO in a significant dip or a Value Dip right now?
USO has a Value Score of 22/100. It is not currently flagged as a significant dip in the Top Dips list. It is not listed as a Value Dip because the long-term sentiment or value-score threshold does not qualify.
View the full interactive analysis on StockDips.AI.