SLV Daily Technical Analysis
iShares Silver Trust
Tracks the price of physical silver bullion. Silver has both monetary and industrial uses, making it more volatile than gold. It is commonly viewed as a leveraged play on precious metals with sensitivity to economic growth, inflation, and speculative cycles.
SLV Technical Analysis Summary
SLV is currently entrenched in a significant long-term correction following a dramatic peak. The technical posture is decidedly bearish, with price trading below the 20, 50, and 200-day SMAs, all of which are sloping downward. While short-term momentum indicators suggest a minor reprieve, long-term investors should exercise caution as the overall structure dictates that the path of least resistance remains lower until key moving averages are decisively reclaimed.
Included In Lists
Related Tickers of Interest
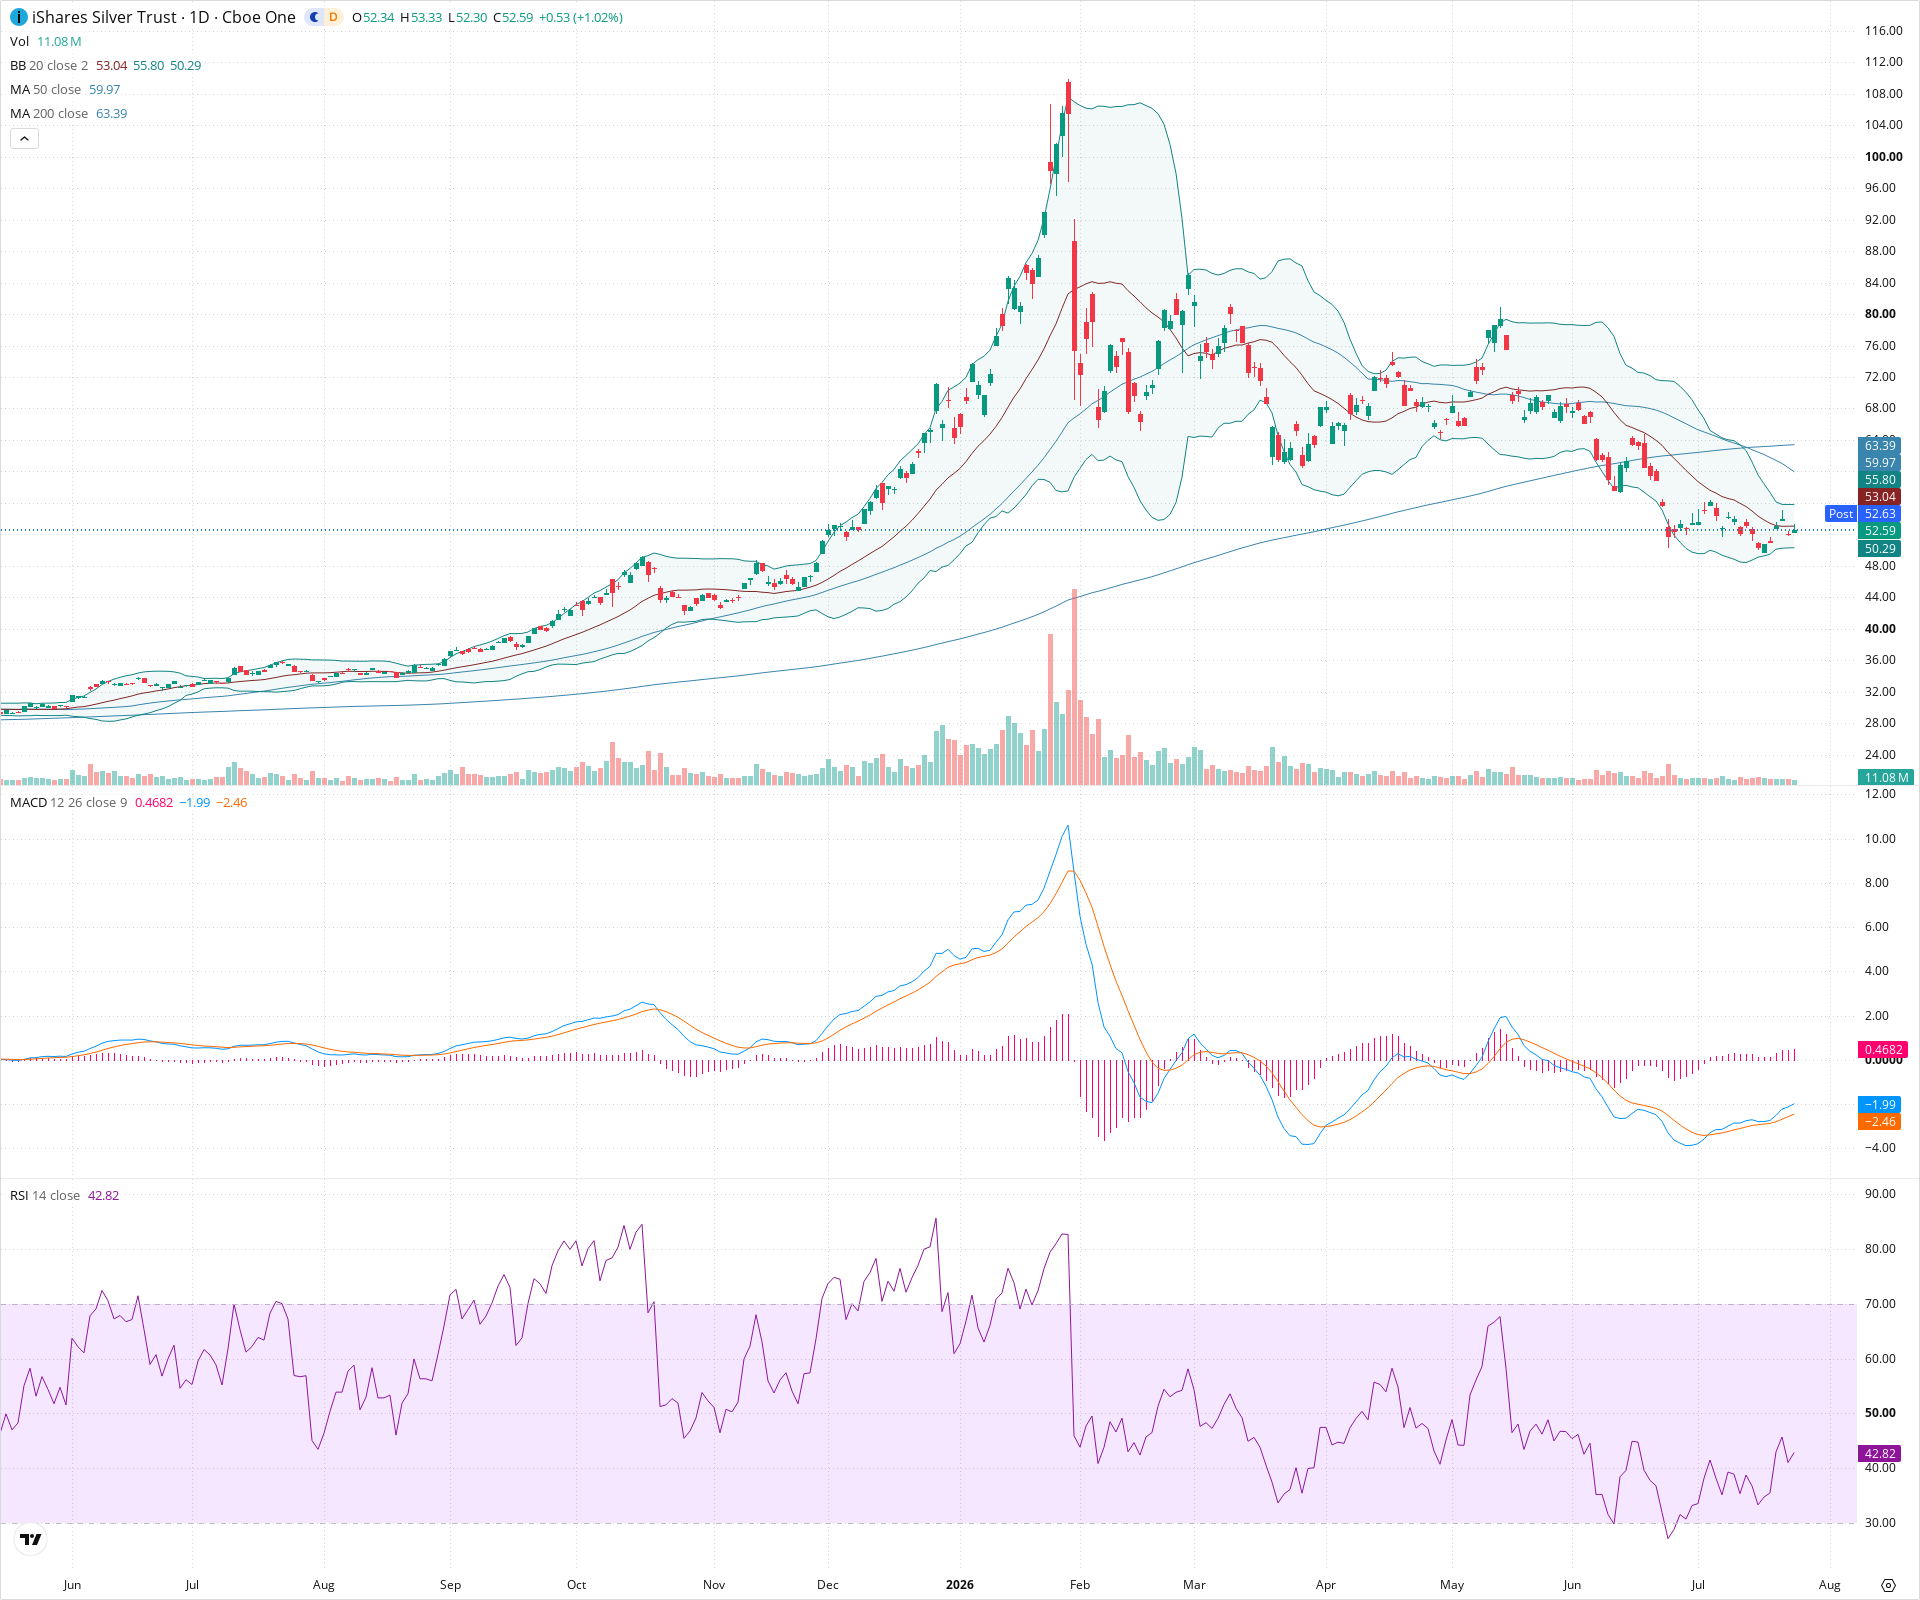
SLV Daily Chart
Sentiment
Short-term Sentiment (days to weeks): Bearish
Price remains suppressed below downward-sloping 20-day and 50-day SMAs. While the MACD shows a recent bullish crossover, it occurred below the zero line, and RSI remains weak below the 50 midpoint, suggesting rallies are likely to be sold.
Long-term Sentiment (weeks to months): Bearish
The asset is in a clear, sustained downtrend defined by lower highs and lower lows. Price is trading significantly below a declining 200-day SMA, indicating a major shift in long-term momentum to the downside following a previous parabolic advance.
Report Metadata
- Timeframe: daily
- Generated at: 2026-07-24T21:16:13.071Z
- Model: gemini-3.1-pro-preview
Support Price Levels
| Level | Range | Strength | Notes |
|---|---|---|---|
| $49.00 | $48.00 - $50.00 | Strong | Recent significant swing low where price found a floor and attempted a minor bounce. |
| $42.00 | $40.00 - $44.00 | Weak | Historical area of consolidation prior to the massive price spike, serving as a longer-term downside target. |
Resistance Price Levels
| Level | Range | Strength | Notes |
|---|---|---|---|
| $54.00 | $53.00 - $55.00 | Strong | Immediate overhead resistance zone encompassing the declining 20-day SMA and recent minor swing highs. |
| $56.75 | $55.50 - $58.00 | Strong | Key resistance band containing the 50-day SMA and prior support-turned-resistance levels. |
| $63.00 | $62.00 - $64.00 | Strong | Major long-term resistance defined by the 200-day SMA and previous swing highs in the downtrend. |
Potential Chart Patterns in Formation
| Strength | Pattern | Signal | Target | Details |
|---|---|---|---|---|
| Strong | Downtrend Structure | Bearish | N/A | A classic sequence of lower highs and lower lows, heavily guided lower by the 20-day and 50-day moving averages acting as dynamic resistance. |
Frequently Asked Questions about SLV
What is the current sentiment for SLV?
The short-term sentiment for SLV is currently Bearish because Price remains suppressed below downward-sloping 20-day and 50-day SMAs. While the MACD shows a recent bullish crossover, it occurred below the zero line, and RSI remains weak below the 50 midpoint, suggesting rallies are likely to be sold.. The long-term trend is classified as Bearish.
What are the key support levels for SLV?
StockDips.AI has identified key support levels for SLV at $49.00 and $42.00. These levels may represent potential accumulation zones where buying interest could emerge.
Is SLV in a significant dip or a Value Dip right now?
SLV has a Value Score of 28/100. It is not currently flagged as a significant dip in the Top Dips list. It is not listed as a Value Dip because the long-term sentiment or value-score threshold does not qualify.
View the full interactive analysis on StockDips.AI.