URA Daily Technical Analysis
Global X Uranium ETF
Provides exposure to companies involved in uranium mining, nuclear fuel production, and nuclear energy infrastructure. Uranium demand is driven by global nuclear power adoption, energy security concerns, and decarbonization initiatives.
URA Technical Analysis Summary
The asset has undergone a significant structural shift, breaking down from a large topping pattern and subsequently falling below its 200-day SMA. Momentum indicators and moving averages confirm the prevailing bearish trend. Long-term investors should exercise caution as the dominant trend is currently downward, with the next major structural support zone seen substantially lower.
Included In Lists
Related Tickers of Interest
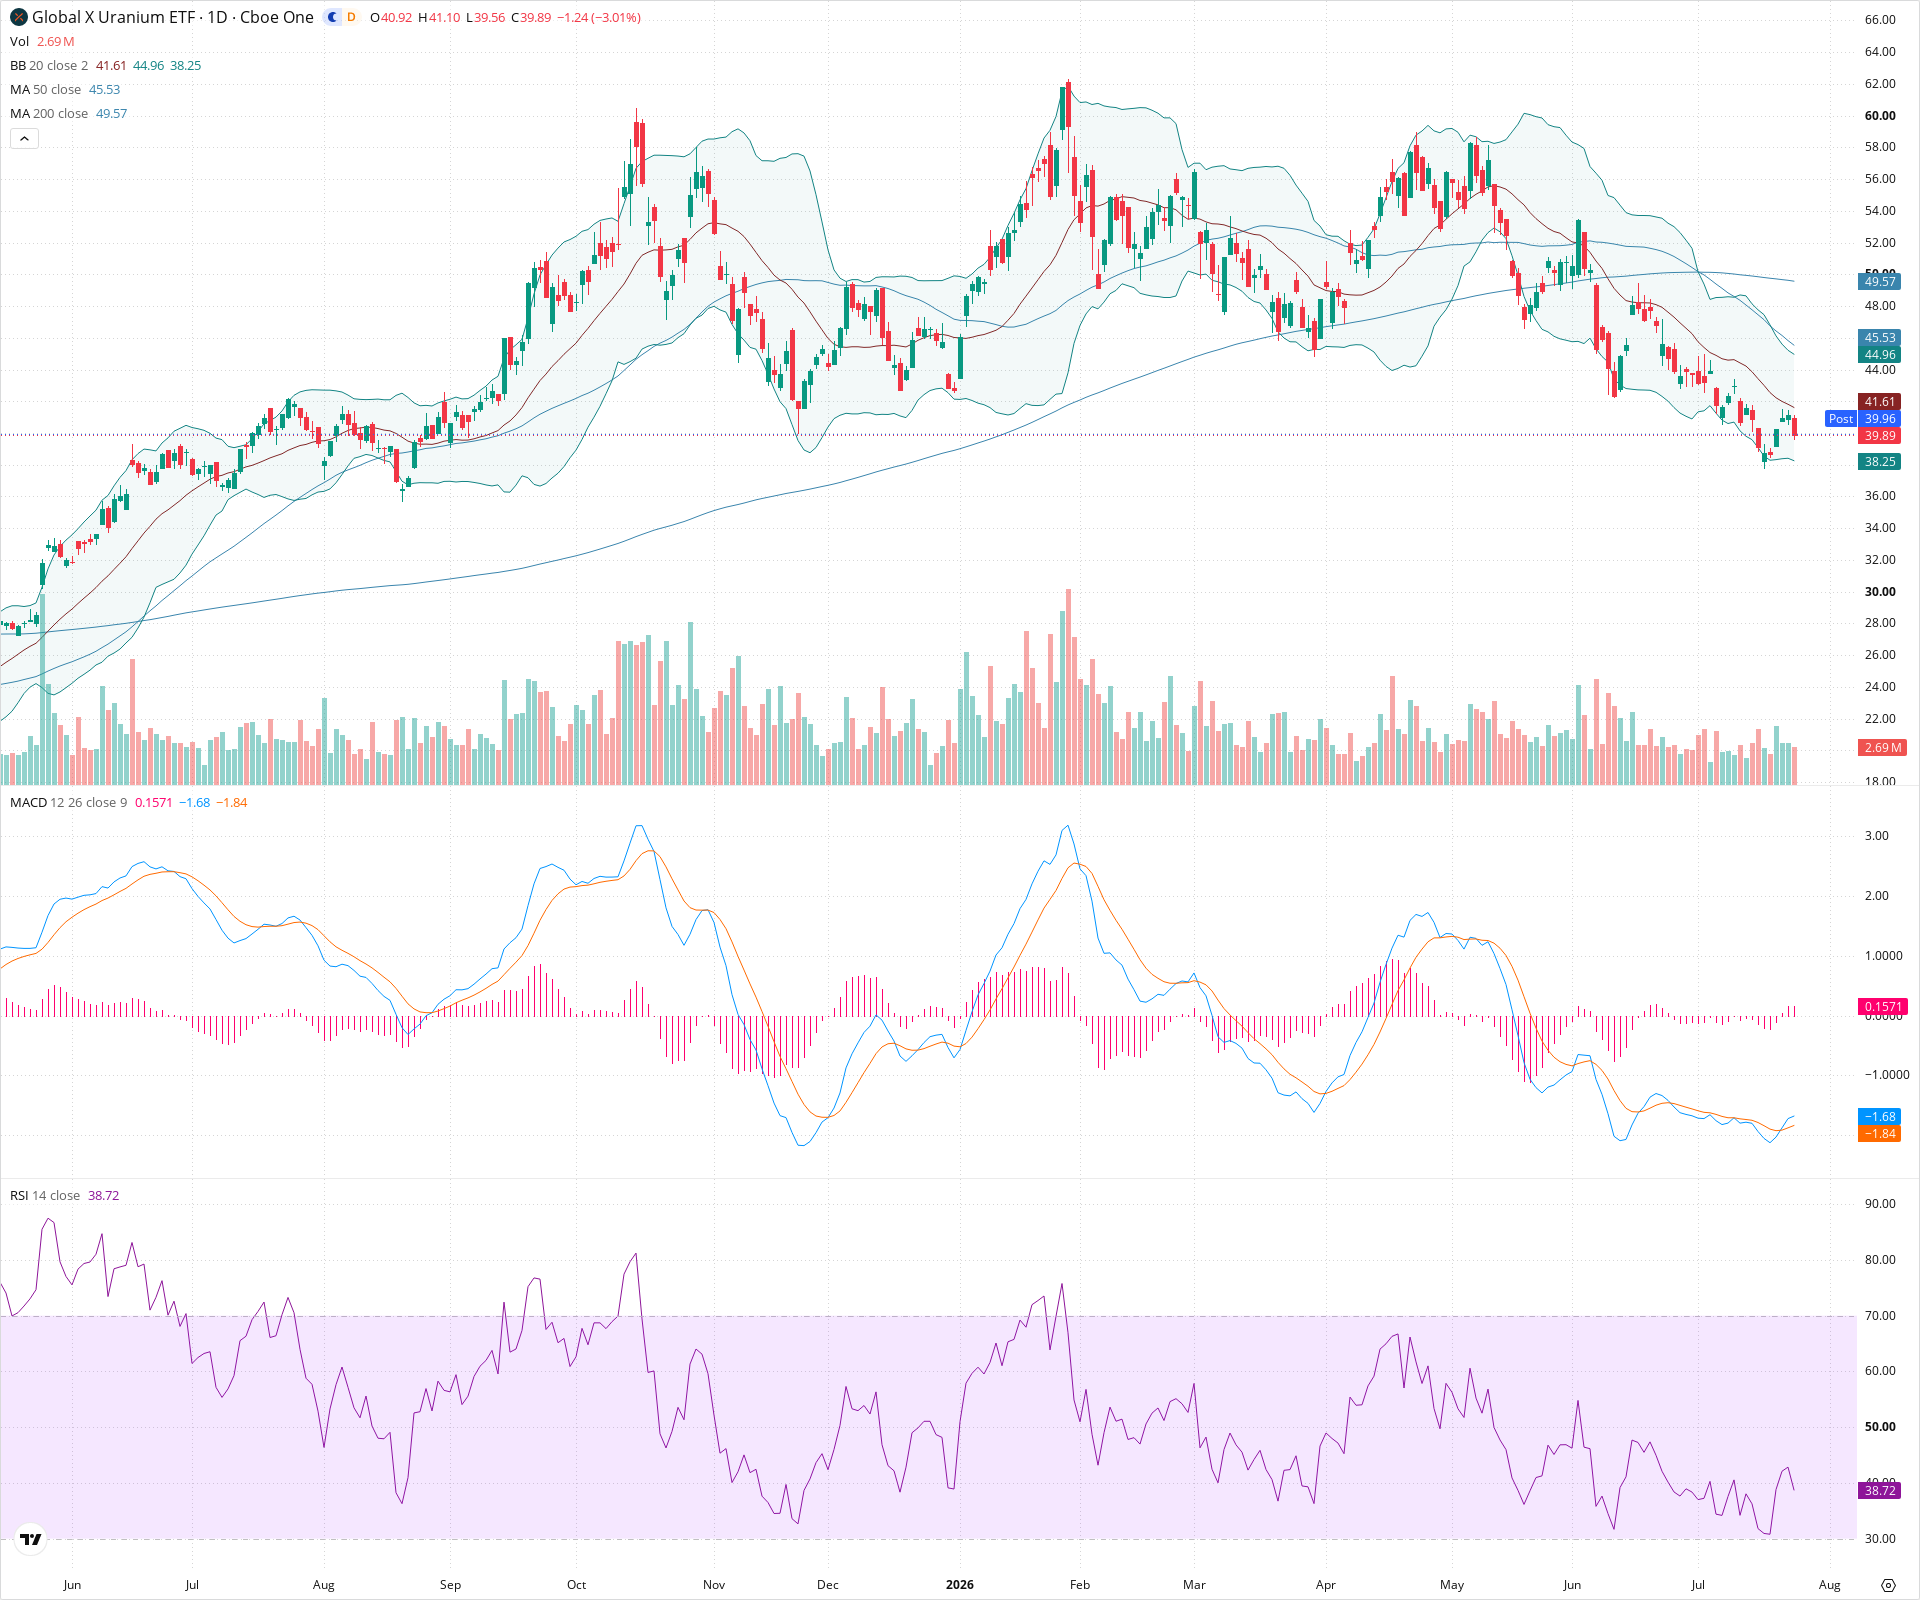
URA Daily Chart
Sentiment
Short-term Sentiment (days to weeks): Bearish
Price is in a near-term downtrend, making lower highs and lower lows, and trading below all three major moving averages. It is near the lower Bollinger Band, with RSI remaining weak but not quite deeply oversold.
Long-term Sentiment (weeks to months): Bearish
The 50-day SMA is sloping downward and price has decisively broken below the 200-day SMA, indicating a shift from a long-term uptrend to a potential long-term downtrend or deep correction.
Report Metadata
- Timeframe: daily
- Generated at: 2026-07-24T21:18:57.800Z
- Model: gemini-3.1-pro-preview
Support Price Levels
| Level | Range | Strength | Notes |
|---|---|---|---|
| $39.50 | $39.00 - $40.00 | Weak | Immediate area around current price; minor historical consolidation. |
| $36.75 | $36.00 - $37.50 | Strong | Previous major swing low area formed several months prior, which may act as substantial historical support if the current decline continues. |
Resistance Price Levels
| Level | Range | Strength | Notes |
|---|---|---|---|
| $45.25 | $44.50 - $46.00 | Strong | Area roughly aligning with the 50-day SMA and recent swing highs that failed to break upward. |
| $49.75 | $49.00 - $50.50 | Strong | Major structural resistance zone aligning with the 200-day SMA and a previous substantial breakdown level. |
Potential Chart Patterns in Formation
| Strength | Pattern | Signal | Target | Details |
|---|---|---|---|---|
| Strong | Head and Shoulders (Top) | Bearish | $35.00 | A large topping structure is visible over the past several months, with a clear breakdown below the neckline (around 46-48), followed by a failed retest and subsequent continuation downward. |
| Strong | Downtrend Channel | Bearish | N/A | Recent price action over the last few months shows a steady sequence of lower highs and lower lows, contained within a descending trajectory. |
Frequently Asked Questions about URA
What is the current sentiment for URA?
The short-term sentiment for URA is currently Bearish because Price is in a near-term downtrend, making lower highs and lower lows, and trading below all three major moving averages. It is near the lower Bollinger Band, with RSI remaining weak but not quite deeply oversold.. The long-term trend is classified as Bearish.
What are the key support levels for URA?
StockDips.AI has identified key support levels for URA at $39.50 and $36.75. These levels may represent potential accumulation zones where buying interest could emerge.
Is URA in a significant dip or a Value Dip right now?
URA has a Value Score of 93/100. It is currently flagged as a significant dip in the Top Dips list. It is not listed as a Value Dip because the long-term sentiment or value-score threshold does not qualify.
View the full interactive analysis on StockDips.AI.