CRSP Weekly Technical Analysis
CRISPR Therapeutics AG
A biotechnology company that develops gene-based medicines.
CRSP Technical Analysis Summary
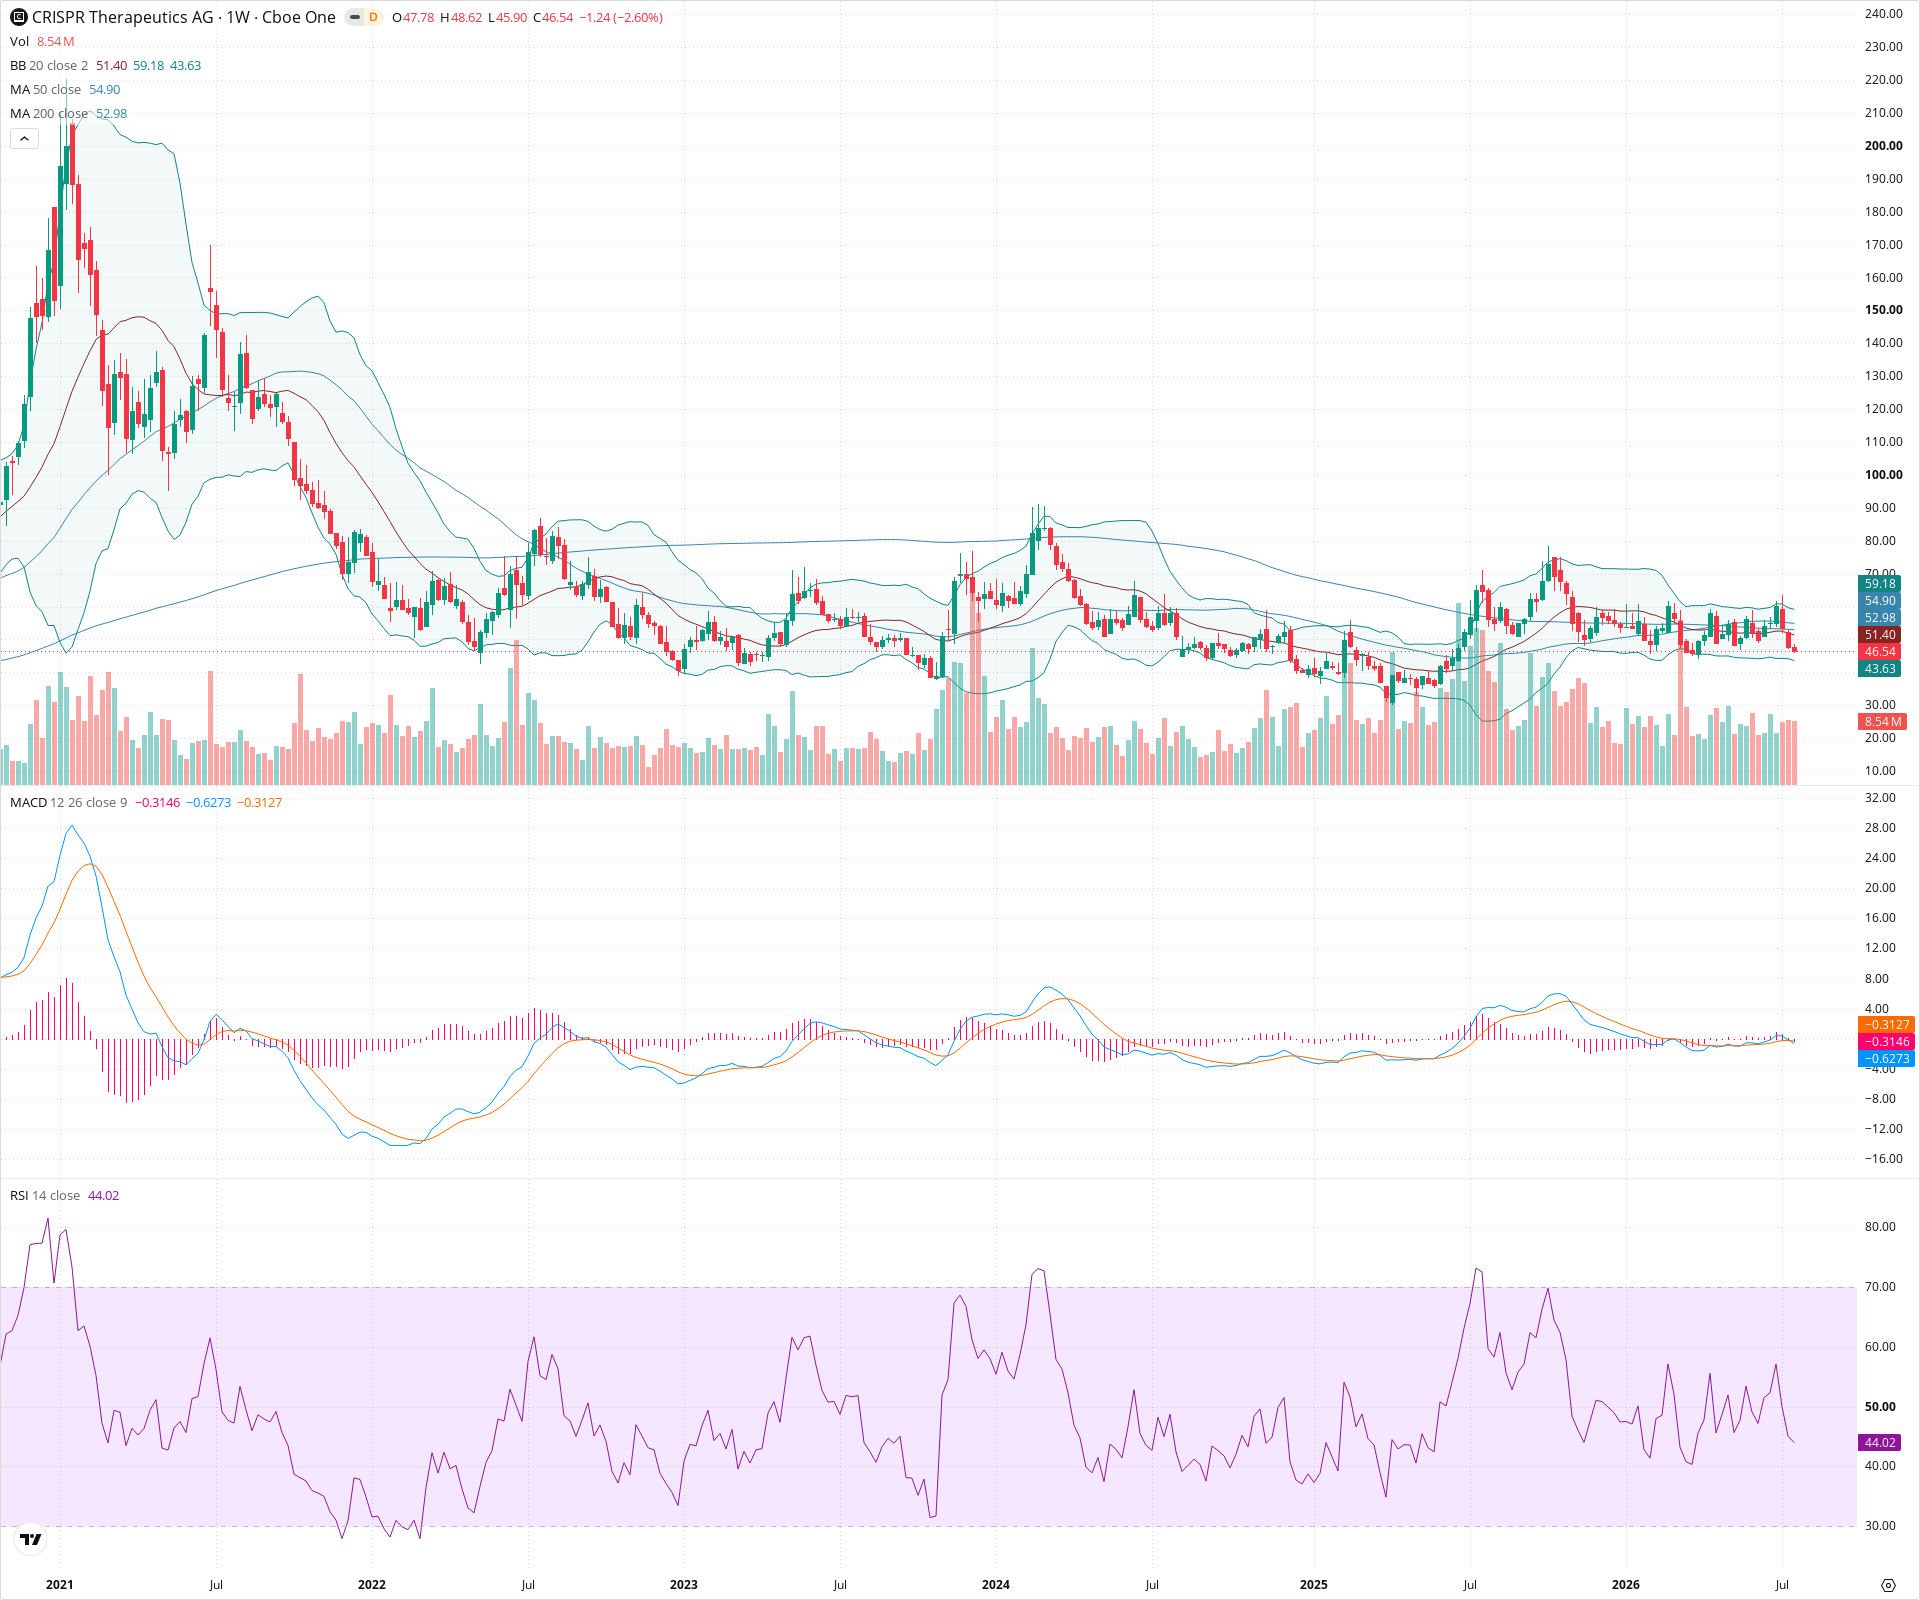
CRSP is in a protracted long-term downtrend, characterized by price remaining below key weekly moving averages. Short-term momentum is negative, with recent rejection at moving average resistance and bearish MACD alignment. The stock is currently testing the lower bounds of a multi-year consolidation range; holding the $40 support zone is critical to prevent further structural breakdown.
Included In Lists
Related Tickers of Interest
CRSP Weekly Chart
Sentiment
Short-term Sentiment (days to weeks): Bearish
Price is trading below all key moving averages (20, 50, and 200-week SMAs). Recent price action shows a series of lower highs and lower lows, and the MACD is negative with a bearish crossover.
Long-term Sentiment (weeks to months): Bearish
The long-term trend is downward since the major peak in early 2021. The 50-week SMA is below the 200-week SMA, and the price remains capped by these long-term moving averages, indicating sustained weakness.
Report Metadata
- Timeframe: weekly
- Generated at: 2026-07-25T09:09:55.401Z
- Model: gemini-3.1-pro-preview
Support Price Levels
| Level | Range | Strength | Notes |
|---|---|---|---|
| $40.00 | $38.00 - $42.00 | Strong | Recent multi-year swing lows formed in late 2023 and early 2024, providing significant floor support. |
| $27.00 | $24.00 - $30.00 | Weak | Historical support zone from early consolidation phases before the major run-up, acting as a potential ultimate downside target if primary support breaks. |
Resistance Price Levels
| Level | Range | Strength | Notes |
|---|---|---|---|
| $53.50 | $52.00 - $55.00 | Strong | Confluence of the 20-week SMA, 200-week SMA, and the middle Bollinger Band, which has recently acted as dynamic resistance. |
| $75.00 | $72.00 - $78.00 | Strong | Significant previous swing high resistance zone established in mid-2023 and early 2024. |
Potential Chart Patterns in Formation
| Strength | Pattern | Signal | Target | Details |
|---|---|---|---|---|
| Strong | Descending Channel / Range | Bearish | N/A | Price has been broadly consolidating in a large, slightly downward-sloping range since the major 2021 decline, capped by lower highs. |
Frequently Asked Questions about CRSP
What is the current sentiment for CRSP?
The short-term sentiment for CRSP is currently Bearish because Price is trading below all key moving averages (20, 50, and 200-week SMAs). Recent price action shows a series of lower highs and lower lows, and the MACD is negative with a bearish crossover.. The long-term trend is classified as Bearish.
What are the key support levels for CRSP?
StockDips.AI has identified key support levels for CRSP at $40.00 and $27.00. These levels may represent potential accumulation zones where buying interest could emerge.
Is CRSP in a significant dip or a Value Dip right now?
CRSP has a Value Score of 66/100. It is not currently flagged as a significant dip in the Top Dips list. It is not listed as a Value Dip because the long-term sentiment or value-score threshold does not qualify.
View the full interactive analysis on StockDips.AI.