Dell Technologies (DELL) Monthly Technical Analysis
Dell Technologies Inc.
Designs, manufactures, and sells personal computers, servers, data storage devices, and enterprise IT infrastructure including AI-optimized server solutions.
DELL Technical Analysis Summary
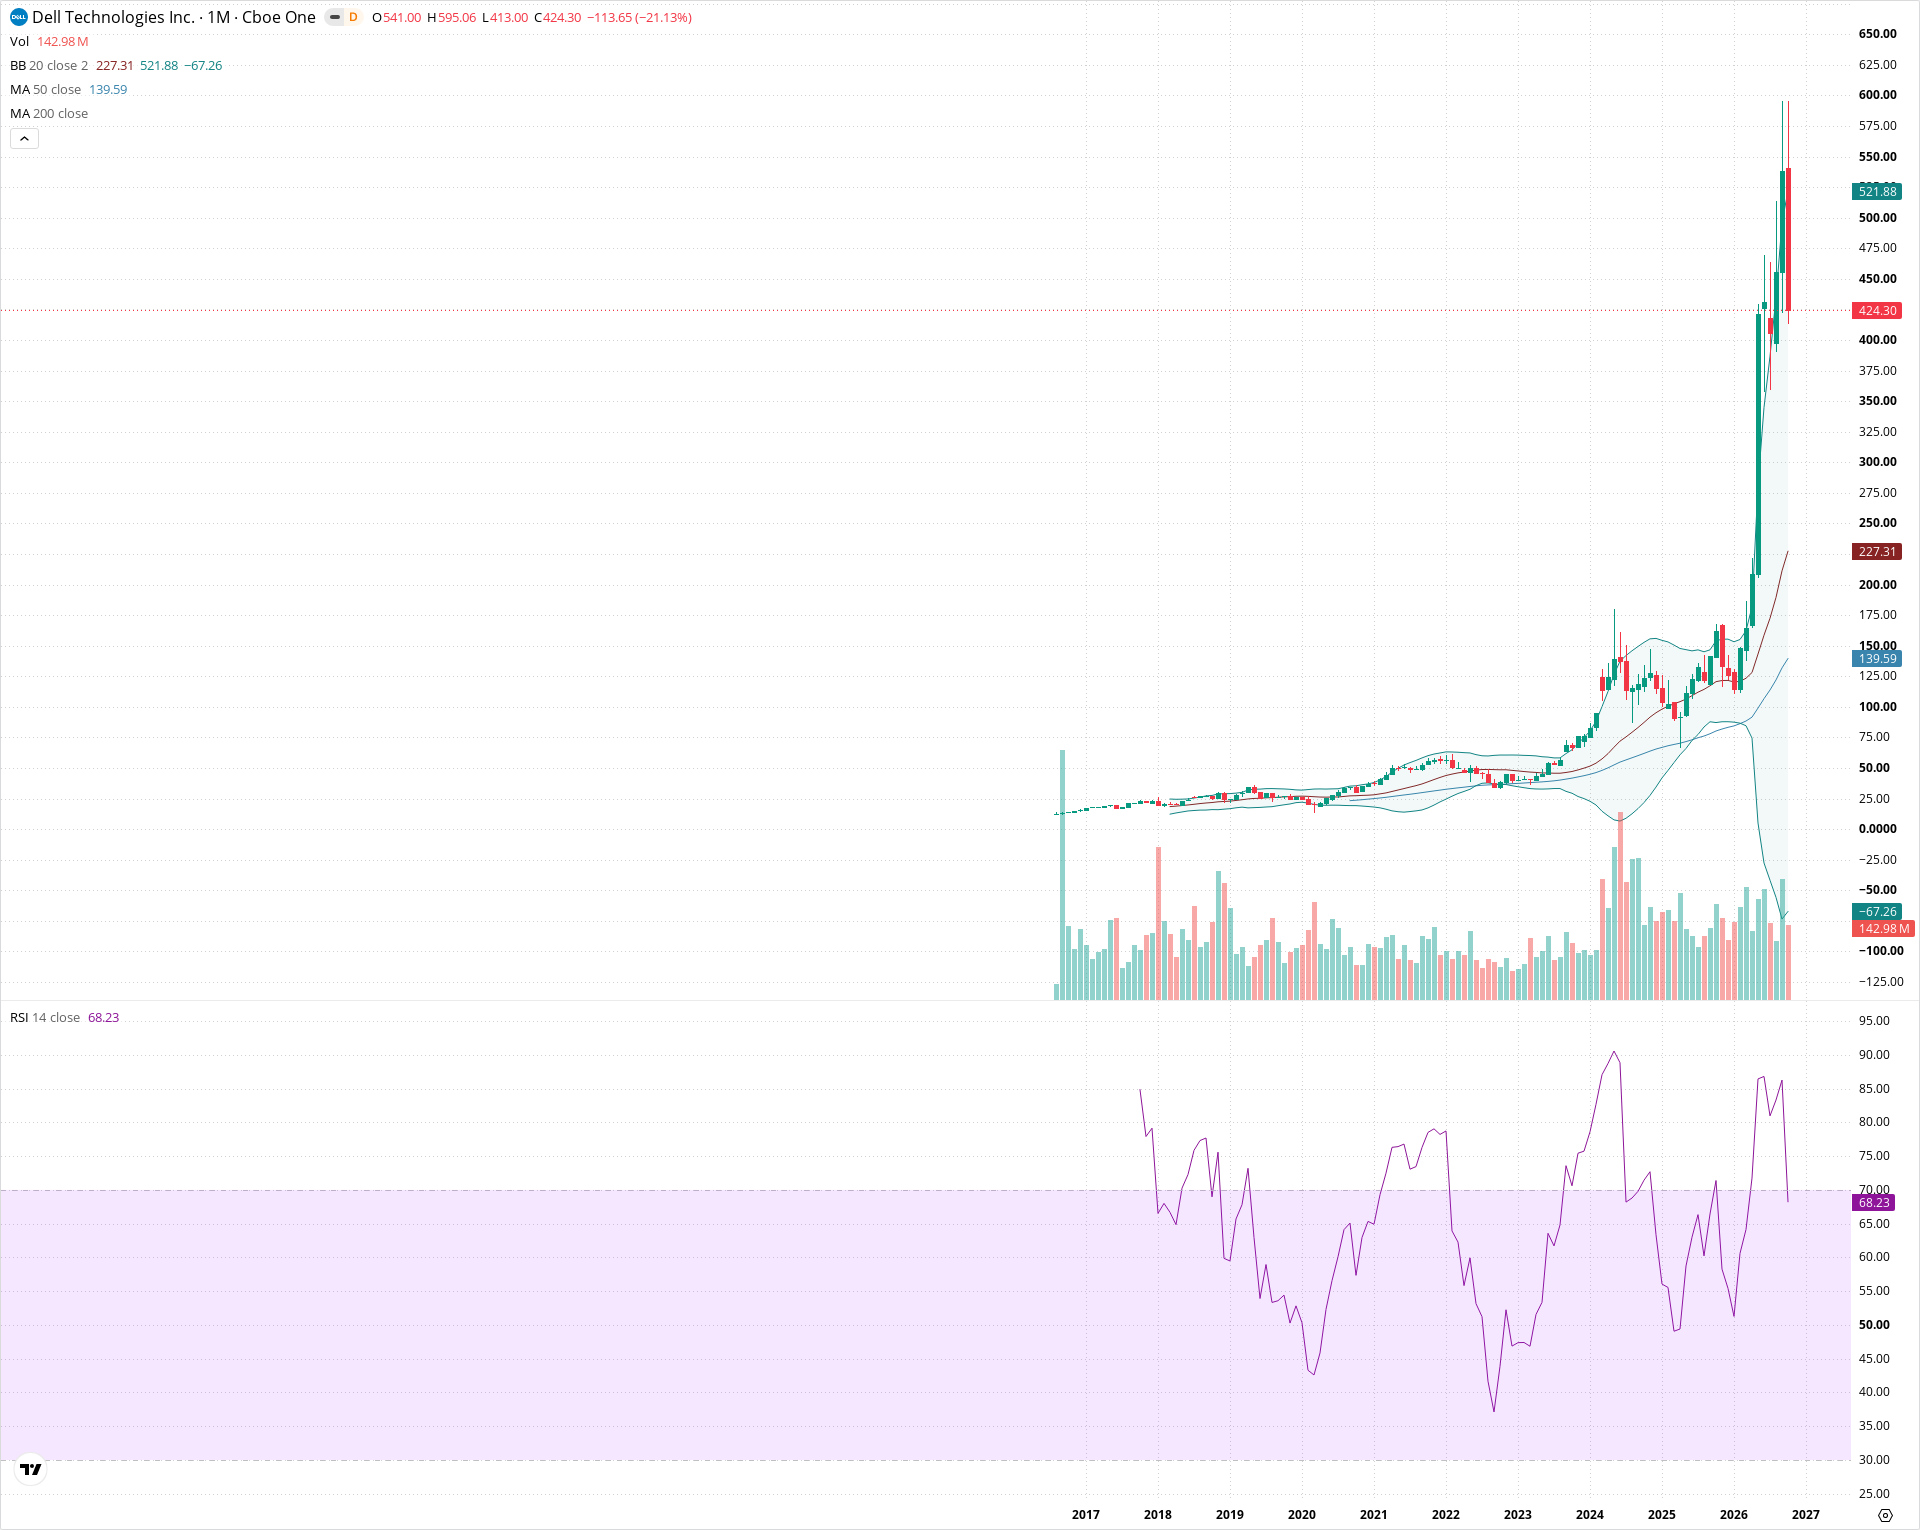
DELL remains in a powerful long-term secular bull market following its massive breakout from a multi-year base in late 2023. While the overarching structural trend is decisively bullish with all key monthly moving averages sloping upward, the current month exhibits a sharp corrective pullback from the peak near 595. Long-term investors should watch for potential stabilization and dynamic support near the rising 20-month SMA around 227.31.
Included In Lists
Related Tickers of Interest
DELL Monthly Chart
Sentiment
Short-term Sentiment (days to weeks): Bearish
Current monthly candle is a severe rejection candle with a long upper wick from the 595.06 high and a steep decline down to 424.30, signaling sharp short-term distribution.
Long-term Sentiment (weeks to months): Bullish
The multi-year secular uptrend remains firmly intact well above the ascending 20-month SMA (227.31) and 50-month SMA (139.59), supported by an RSI at 68.23 confirming a broad bull regime.
Report Metadata
- Timeframe: monthly
- Generated at: Nov 1, 2026
- Model: gemini-3.8-flash
Support Price Levels
| Level | Range | Strength | Notes |
|---|---|---|---|
| $225.00 | $220.00 - $230.00 | Strong | Confluence of the rising 20-month moving average (227.31) and the Bollinger Band baseline. |
| $140.00 | $130.00 - $150.00 | Strong | Major prior consolidation breakout shelf aligned closely with the 50-month moving average at 139.59. |
Resistance Price Levels
| Level | Range | Strength | Notes |
|---|---|---|---|
| $590.00 | $580.00 - $600.00 | Strong | All-time peak and secular resistance zone established by the recent monthly high at 595.06. |
Potential Chart Patterns in Formation
| Strength | Pattern | Signal | Target | Details |
|---|---|---|---|---|
| Strong | Secular Base Breakout and Parabolic Extension | Bullish | N/A | Prolonged multi-year accumulation base between 35 and 60 broke out decisively in late 2023, transitioning into a multi-month parabolic impulse that is now undergoing mean reversion. |
Frequently Asked Questions about DELL
What is the current sentiment for DELL?
The short-term sentiment for DELL is currently Bearish because Current monthly candle is a severe rejection candle with a long upper wick from the 595.06 high and a steep decline down to 424.30, signaling sharp short-term distribution. The long-term trend is classified as Bullish.
What are the key support levels for DELL?
StockDips.AI has identified key support levels for DELL at $225.00 and $140.00. These levels may represent potential accumulation zones where buying interest could emerge.
Is DELL in a significant dip or a Value Dip right now?
DELL has a Value Score of 90/100. It is currently flagged as a significant dip in the Top Dips list. It is also listed as a Value Dip because long-term sentiment is bullish.
View the full interactive analysis on StockDips.AI.