ENPH Daily Technical Analysis
Enphase Energy, Inc
Home energy technology specializing in solutions that manage energy generation, storage, control, and communication through one integrated platform.
This is a historical daily technical analysis report for ENPH, generated on June 2, 2026 at 2:16 PM UTC.
ENPH Technical Analysis Summary
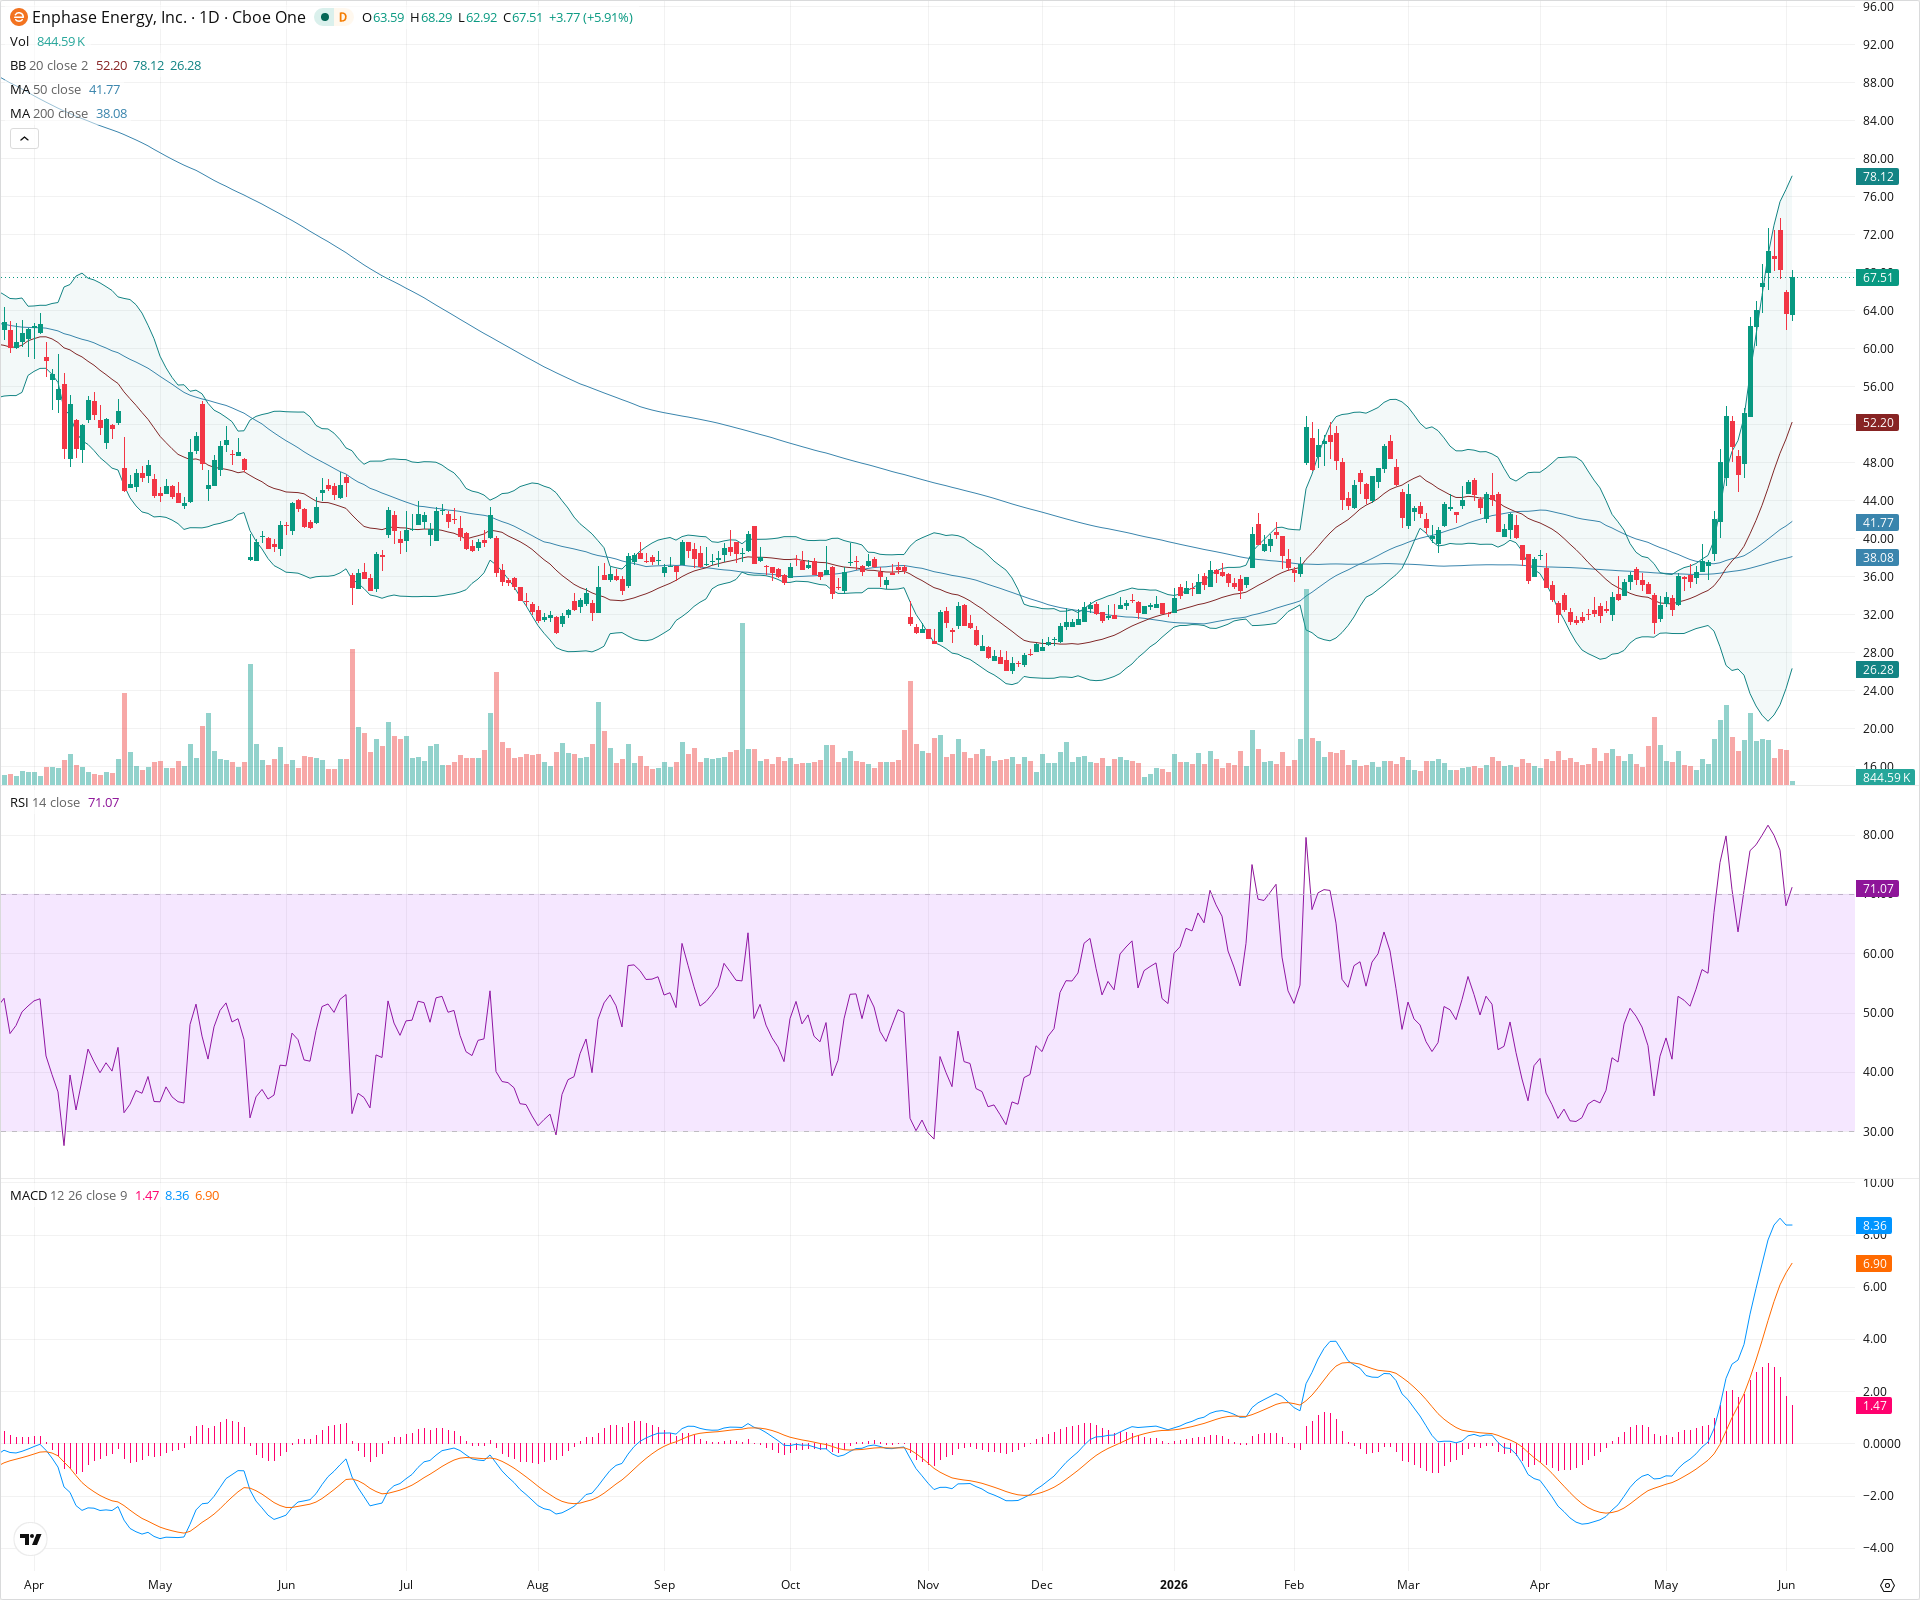
ENPH has recently experienced a dramatic upside breakout on exceptionally high volume, shifting the long-term technical structure firmly to bullish, highlighted by a recent Golden Cross. Following a parabolic surge to the low 80s, the stock is currently engaged in a sharp, necessary mean-reversion phase. While near-term price action is volatile as momentum indicators cool, the broader technical picture remains constructive for long-term investors once a new higher base is established.
Included In Lists
Related Tickers of Interest
Historical Report Navigation
Browse adjacent archived reports or jump back to the latest live analysis page.
ENPH Daily Chart
Sentiment
Short-term Sentiment (days to weeks): Neutral
Price is currently undergoing a sharp mean-reversion pullback following a parabolic, overextended advance. Momentum indicators like the MACD histogram are decelerating, and RSI is cooling off from extreme overbought levels, suggesting a volatile period of consolidation is underway.
Long-term Sentiment (weeks to months): Bullish
A major structural breakout occurred on massive volume. The 50-day SMA has crossed above the 200-day SMA (Golden Cross), and the price remains significantly above all major rising moving averages, indicating a confirmed long-term trend reversal to the upside.
Report Metadata
- Timeframe: daily
- Generated at: Jun 2, 2026
- Model: gemini-3.1-pro-preview
Support Price Levels
| Level | Range | Strength | Notes |
|---|---|---|---|
| $52.00 | $50.00 - $54.00 | Weak | Initial mean-reversion target zone aligning roughly with the rapidly rising 20-day SMA (middle Bollinger Band). |
| $40.00 | $38.00 - $42.00 | Strong | Major structural support zone comprising the initial breakout origin area and the cluster of the rising 50-day and 200-day SMAs. |
Resistance Price Levels
| Level | Range | Strength | Notes |
|---|---|---|---|
| $76.00 | $74.00 - $78.00 | Weak | Near-term resistance formed by recent minor lower highs during the current intraday/daily pullback phase. |
| $82.00 | $80.00 - $84.00 | Strong | The recent absolute peak of the parabolic advance, representing a major supply zone where extreme overbought conditions were firmly rejected. |
Potential Chart Patterns in Formation
| Strength | Pattern | Signal | Target | Details |
|---|---|---|---|---|
| Strong | Mean Reversion / Flag Formation | Neutral | N/A | After an explosive, near-vertical surge that pushed price far outside the upper Bollinger Band, the asset is experiencing a natural correction to digest gains. This may eventually form a bullish flag or pennant if support holds. |
| Strong | Golden Cross | Bullish | N/A | The 50-day Simple Moving Average has decisively crossed above the 200-day Simple Moving Average, providing a classic technical signal of a shifting long-term trend. |
Frequently Asked Questions about ENPH
What is the current sentiment for ENPH?
The short-term sentiment for ENPH is currently Neutral because Price is currently undergoing a sharp mean-reversion pullback following a parabolic, overextended advance. Momentum indicators like the MACD histogram are decelerating, and RSI is cooling off from extreme overbought levels, suggesting a volatile period of consolidation is underway. The long-term trend is classified as Bullish.
What are the key support levels for ENPH?
StockDips.AI has identified key support levels for ENPH at $52.00 and $40.00. These levels may represent potential accumulation zones where buying interest could emerge.
Is ENPH in a significant dip or a Value Dip right now?
ENPH has a Value Score of 85/100. It is currently flagged as a significant dip in the Top Dips list. It is also listed as a Value Dip because long-term sentiment is bullish.
View the full interactive analysis on StockDips.AI.