GLD Weekly Technical Analysis
SPDR Gold Shares
Tracks the spot price of physical gold bullion held in secure vaults. Roughly ~1/10 oz of gold per share. Often used as a hedge against inflation, currency debasement, geopolitical risk, and financial market stress. Gold is considered a store of value and tends to perform well during risk-off environments.
GLD Technical Analysis Summary
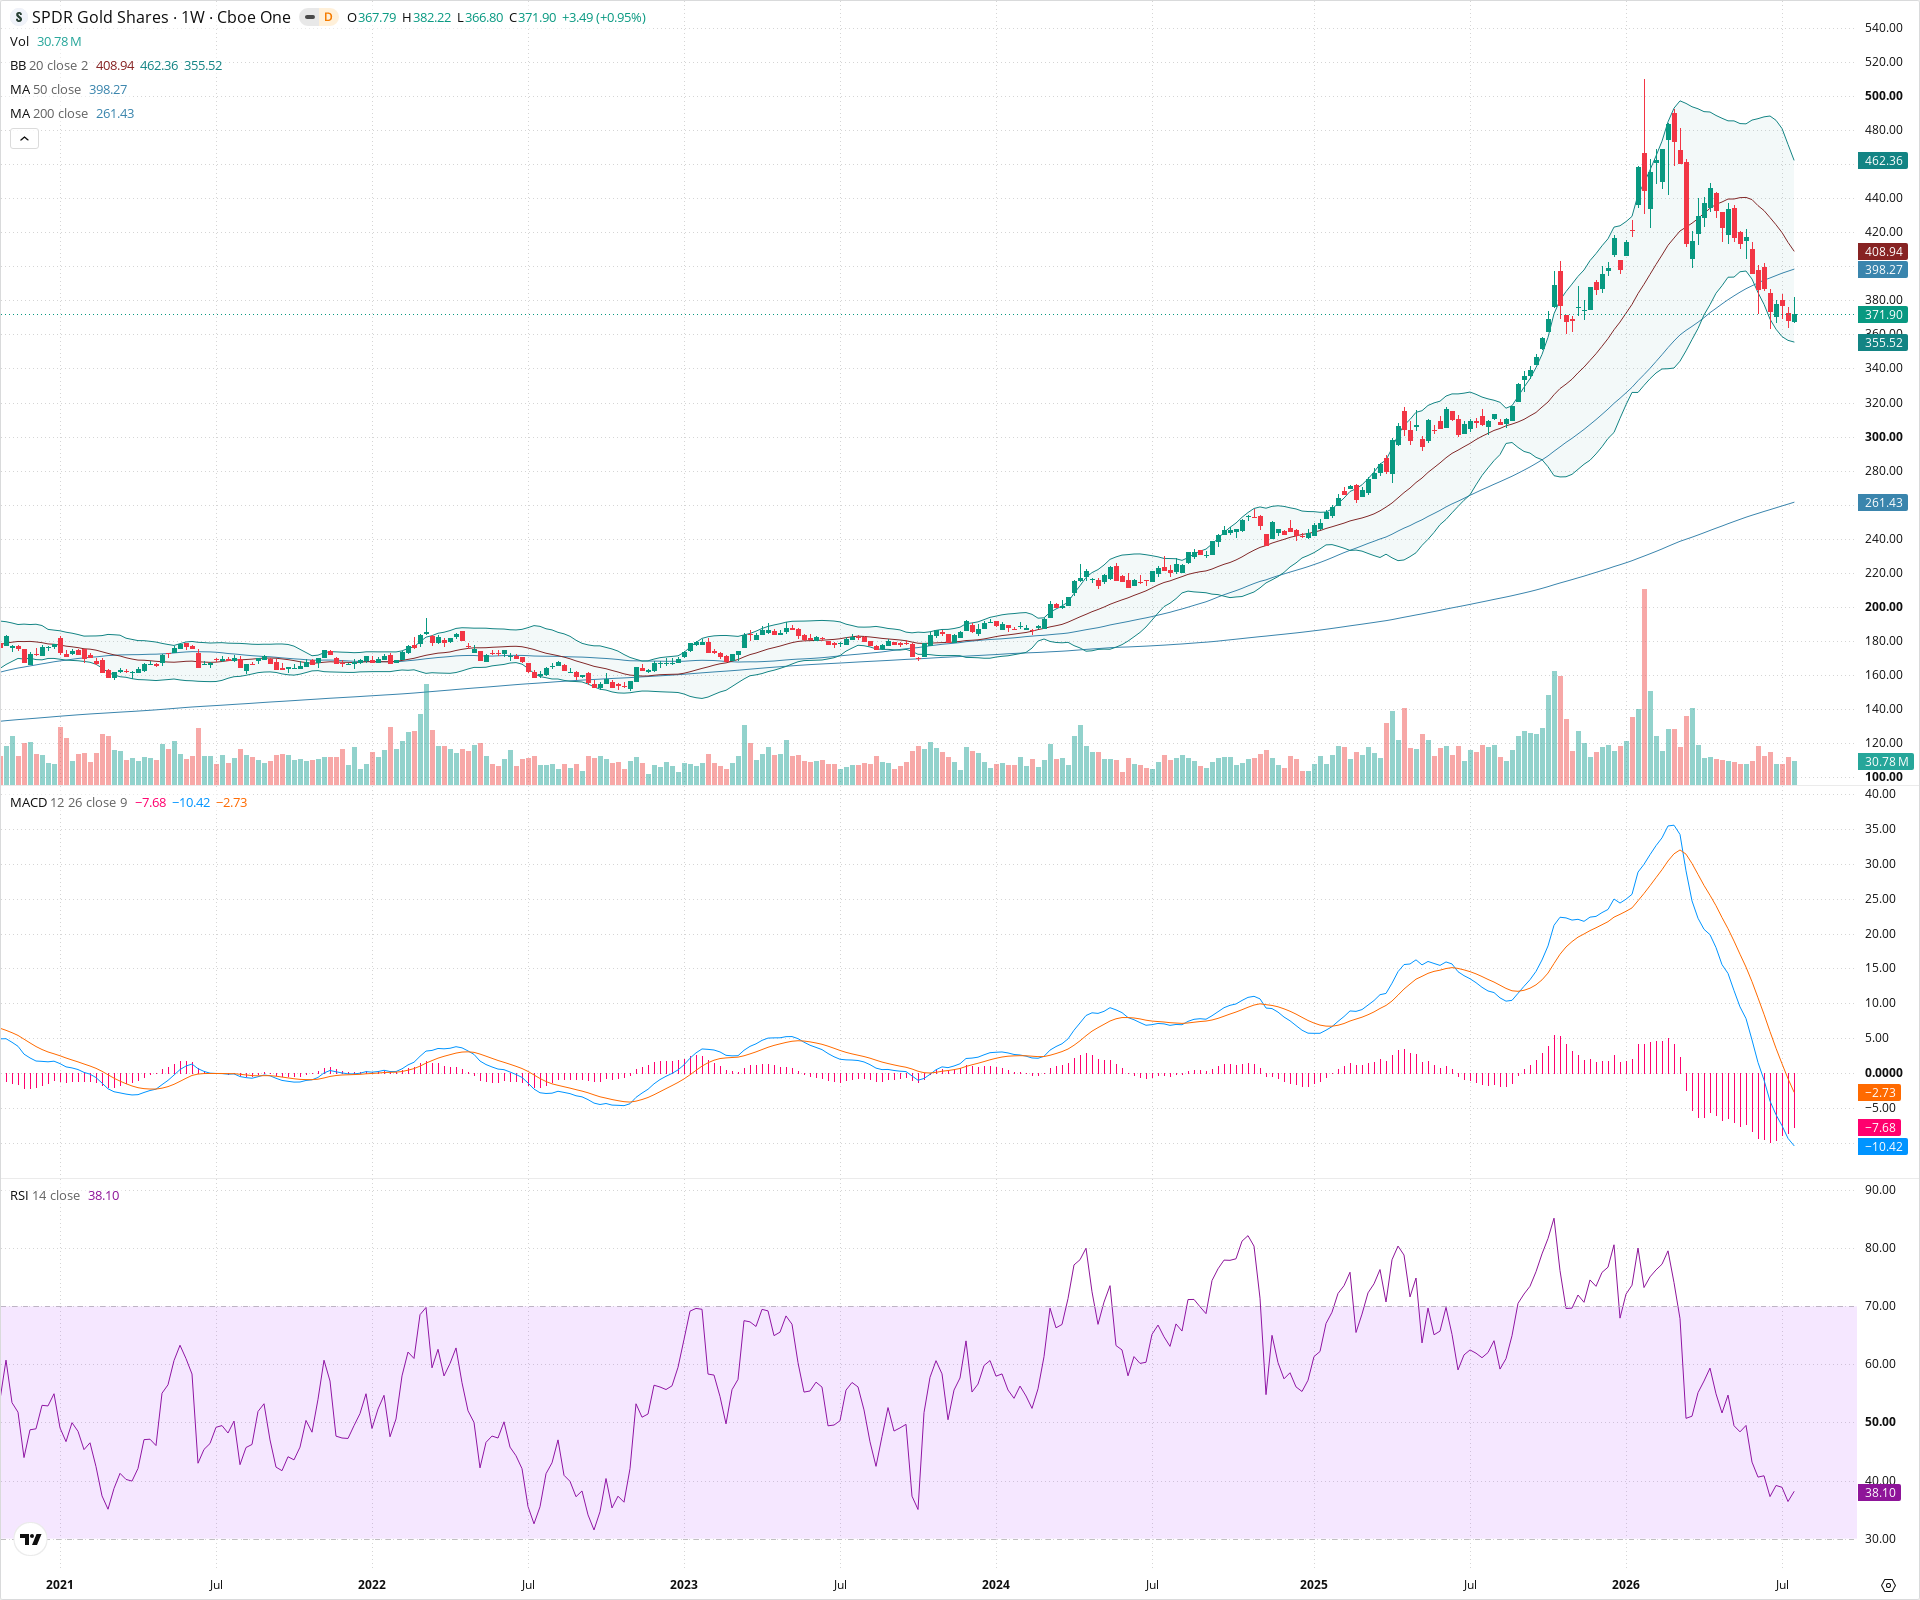
GLD is currently undergoing a severe multi-week correction following a parabolic blow-off top near 500. The short-term technical picture is heavily bearish, with price slicing through the 50-week SMA alongside accelerating downside momentum in both the MACD and RSI. Long-term investors should watch for potential stabilization near the 350-360 support zone, as the asset attempts to digest its massive prior gains.
Included In Lists
Related Tickers of Interest
GLD Weekly Chart
Sentiment
Short-term Sentiment (days to weeks): Bearish
Price is in a steep, multi-week downtrend, having broken below both the 20-week and 50-week SMAs. RSI is falling sharply toward oversold, and MACD shows strong negative momentum.
Long-term Sentiment (weeks to months): Neutral
While the overarching multi-year trend was strongly bullish, the current severe correction has damaged the intermediate technical structure. The price remains well above the 200-week SMA, but needs to form a new base before long-term bullishness can confidently resume.
Report Metadata
- Timeframe: weekly
- Generated at: 2026-07-25T09:12:02.298Z
- Model: gemini-3.1-pro-preview
Support Price Levels
| Level | Range | Strength | Notes |
|---|---|---|---|
| $355.00 | $350.00 - $360.00 | Strong | Aligns with the lower Bollinger Band (355.52) and a prior area of consolidation from early 2025. |
| $300.00 | $290.00 - $310.00 | Strong | Major psychological level and prior structural breakout zone from late 2024. |
Resistance Price Levels
| Level | Range | Strength | Notes |
|---|---|---|---|
| $402.50 | $395.00 - $410.00 | Strong | Confluence zone of the broken 50-week SMA (398.27) and the declining 20-week SMA (408.94). |
| $442.50 | $435.00 - $450.00 | Strong | Recent structural lower high formed during the current downtrend. |
Potential Chart Patterns in Formation
| Strength | Pattern | Signal | Target | Details |
|---|---|---|---|---|
| Strong | Sharp Correction / Blow-off Top Reversal | Bearish | N/A | After a massive parabolic advance to near 500, the asset has experienced a rapid and severe sell-off, characterized by consecutive large red weekly candles and a break of major moving averages. |
Frequently Asked Questions about GLD
What is the current sentiment for GLD?
The short-term sentiment for GLD is currently Bearish because Price is in a steep, multi-week downtrend, having broken below both the 20-week and 50-week SMAs. RSI is falling sharply toward oversold, and MACD shows strong negative momentum.. The long-term trend is classified as Neutral.
What are the key support levels for GLD?
StockDips.AI has identified key support levels for GLD at $355.00 and $300.00. These levels may represent potential accumulation zones where buying interest could emerge.
Is GLD in a significant dip or a Value Dip right now?
GLD has a Value Score of 62/100. It is not currently flagged as a significant dip in the Top Dips list. It is not listed as a Value Dip because the long-term sentiment or value-score threshold does not qualify.
View the full interactive analysis on StockDips.AI.