GRAB Daily Technical Analysis
Grab Holdings Ltd
Southeast Asian super app offering ride-hailing, food delivery, and financial services.
GRAB Technical Analysis Summary
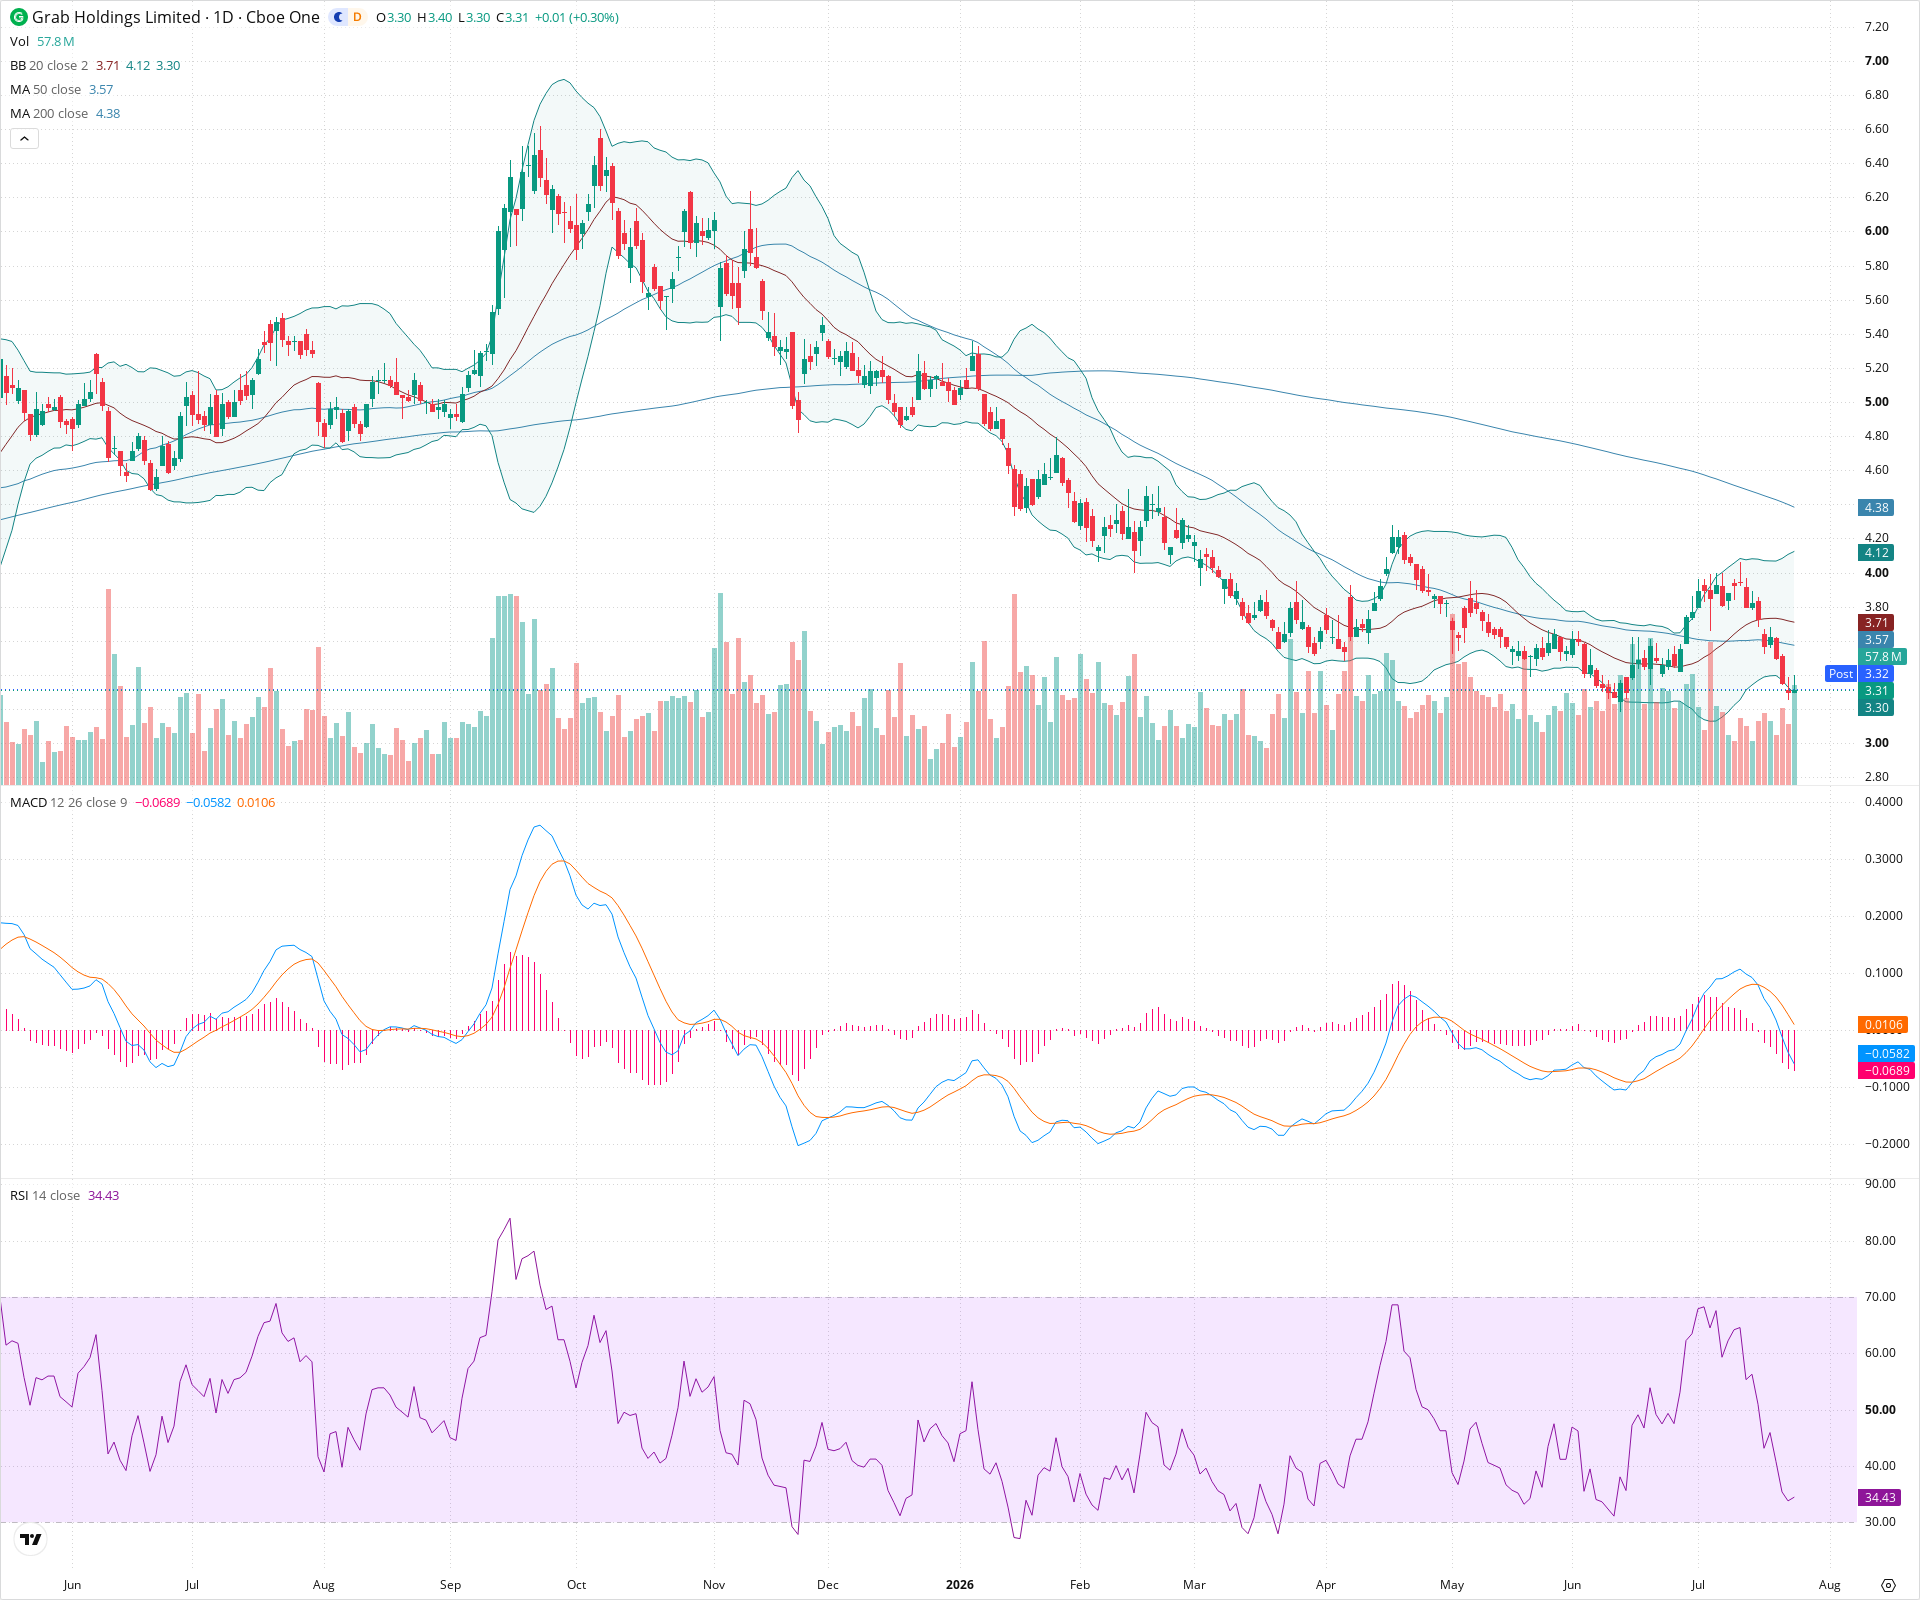
The technical structure for GRAB remains decidedly bearish across both short and long-term timeframes. The stock is entrenched in a persistent downtrend, trading below all key moving averages with negative momentum confirmed by MACD and RSI. A recent rejection at the 200 SMA has catalyzed the current leg down. For long-term investors, the technicals do not yet suggest a durable bottom is in place, and further downside toward the major $2.80–$3.00 support zone appears likely unless momentum shifts dramatically.
Included In Lists
Related Tickers of Interest
GRAB Daily Chart
Sentiment
Short-term Sentiment (days to weeks): Bearish
Price is trading below all major SMAs (20, 50, 200). Recent candles show consistent selling pressure. MACD is negative and expanding downward. RSI is approaching oversold territory, suggesting strong downside momentum.
Long-term Sentiment (weeks to months): Bearish
The 200 SMA is declining, and the 50 SMA is below the 200 SMA, indicating a persistent long-term downtrend. Price continues to make lower highs and lower lows on a macro scale.
Report Metadata
- Timeframe: daily
- Generated at: 2026-07-24T21:07:09.201Z
- Model: gemini-3.1-pro-preview
Support Price Levels
| Level | Range | Strength | Notes |
|---|---|---|---|
| $3.25 | $3.20 - $3.30 | Weak | Minor support area based on recent swing lows and consolidation in June. |
| $2.90 | $2.80 - $3.00 | Strong | Major historical support zone established in March, which halted the previous downtrend. |
Resistance Price Levels
| Level | Range | Strength | Notes |
|---|---|---|---|
| $3.60 | $3.50 - $3.70 | Strong | Cluster of resistance formed by the 20 and 50 SMAs, along with recent swing highs in early August. |
| $4.10 | $4.00 - $4.20 | Strong | Significant resistance zone marked by the declining 200 SMA and a major swing high from mid-July. |
Potential Chart Patterns in Formation
| Strength | Pattern | Signal | Target | Details |
|---|---|---|---|---|
| Strong | Downtrend Continuation | Bearish | $2.80 | Price recently rejected from the 200 SMA resistance and broke below short-term support, resuming the broader bearish trend. |
Frequently Asked Questions about GRAB
What is the current sentiment for GRAB?
The short-term sentiment for GRAB is currently Bearish because Price is trading below all major SMAs (20, 50, 200). Recent candles show consistent selling pressure. MACD is negative and expanding downward. RSI is approaching oversold territory, suggesting strong downside momentum.. The long-term trend is classified as Bearish.
What are the key support levels for GRAB?
StockDips.AI has identified key support levels for GRAB at $3.25 and $2.90. These levels may represent potential accumulation zones where buying interest could emerge.
Is GRAB in a significant dip or a Value Dip right now?
GRAB has a Value Score of 83/100. It is currently flagged as a significant dip in the Top Dips list. It is not listed as a Value Dip because the long-term sentiment or value-score threshold does not qualify.
View the full interactive analysis on StockDips.AI.