JNJ Weekly Technical Analysis
Johnson & Johnson
Global healthcare giant in pharma, medical devices, and consumer health
JNJ Technical Analysis Summary
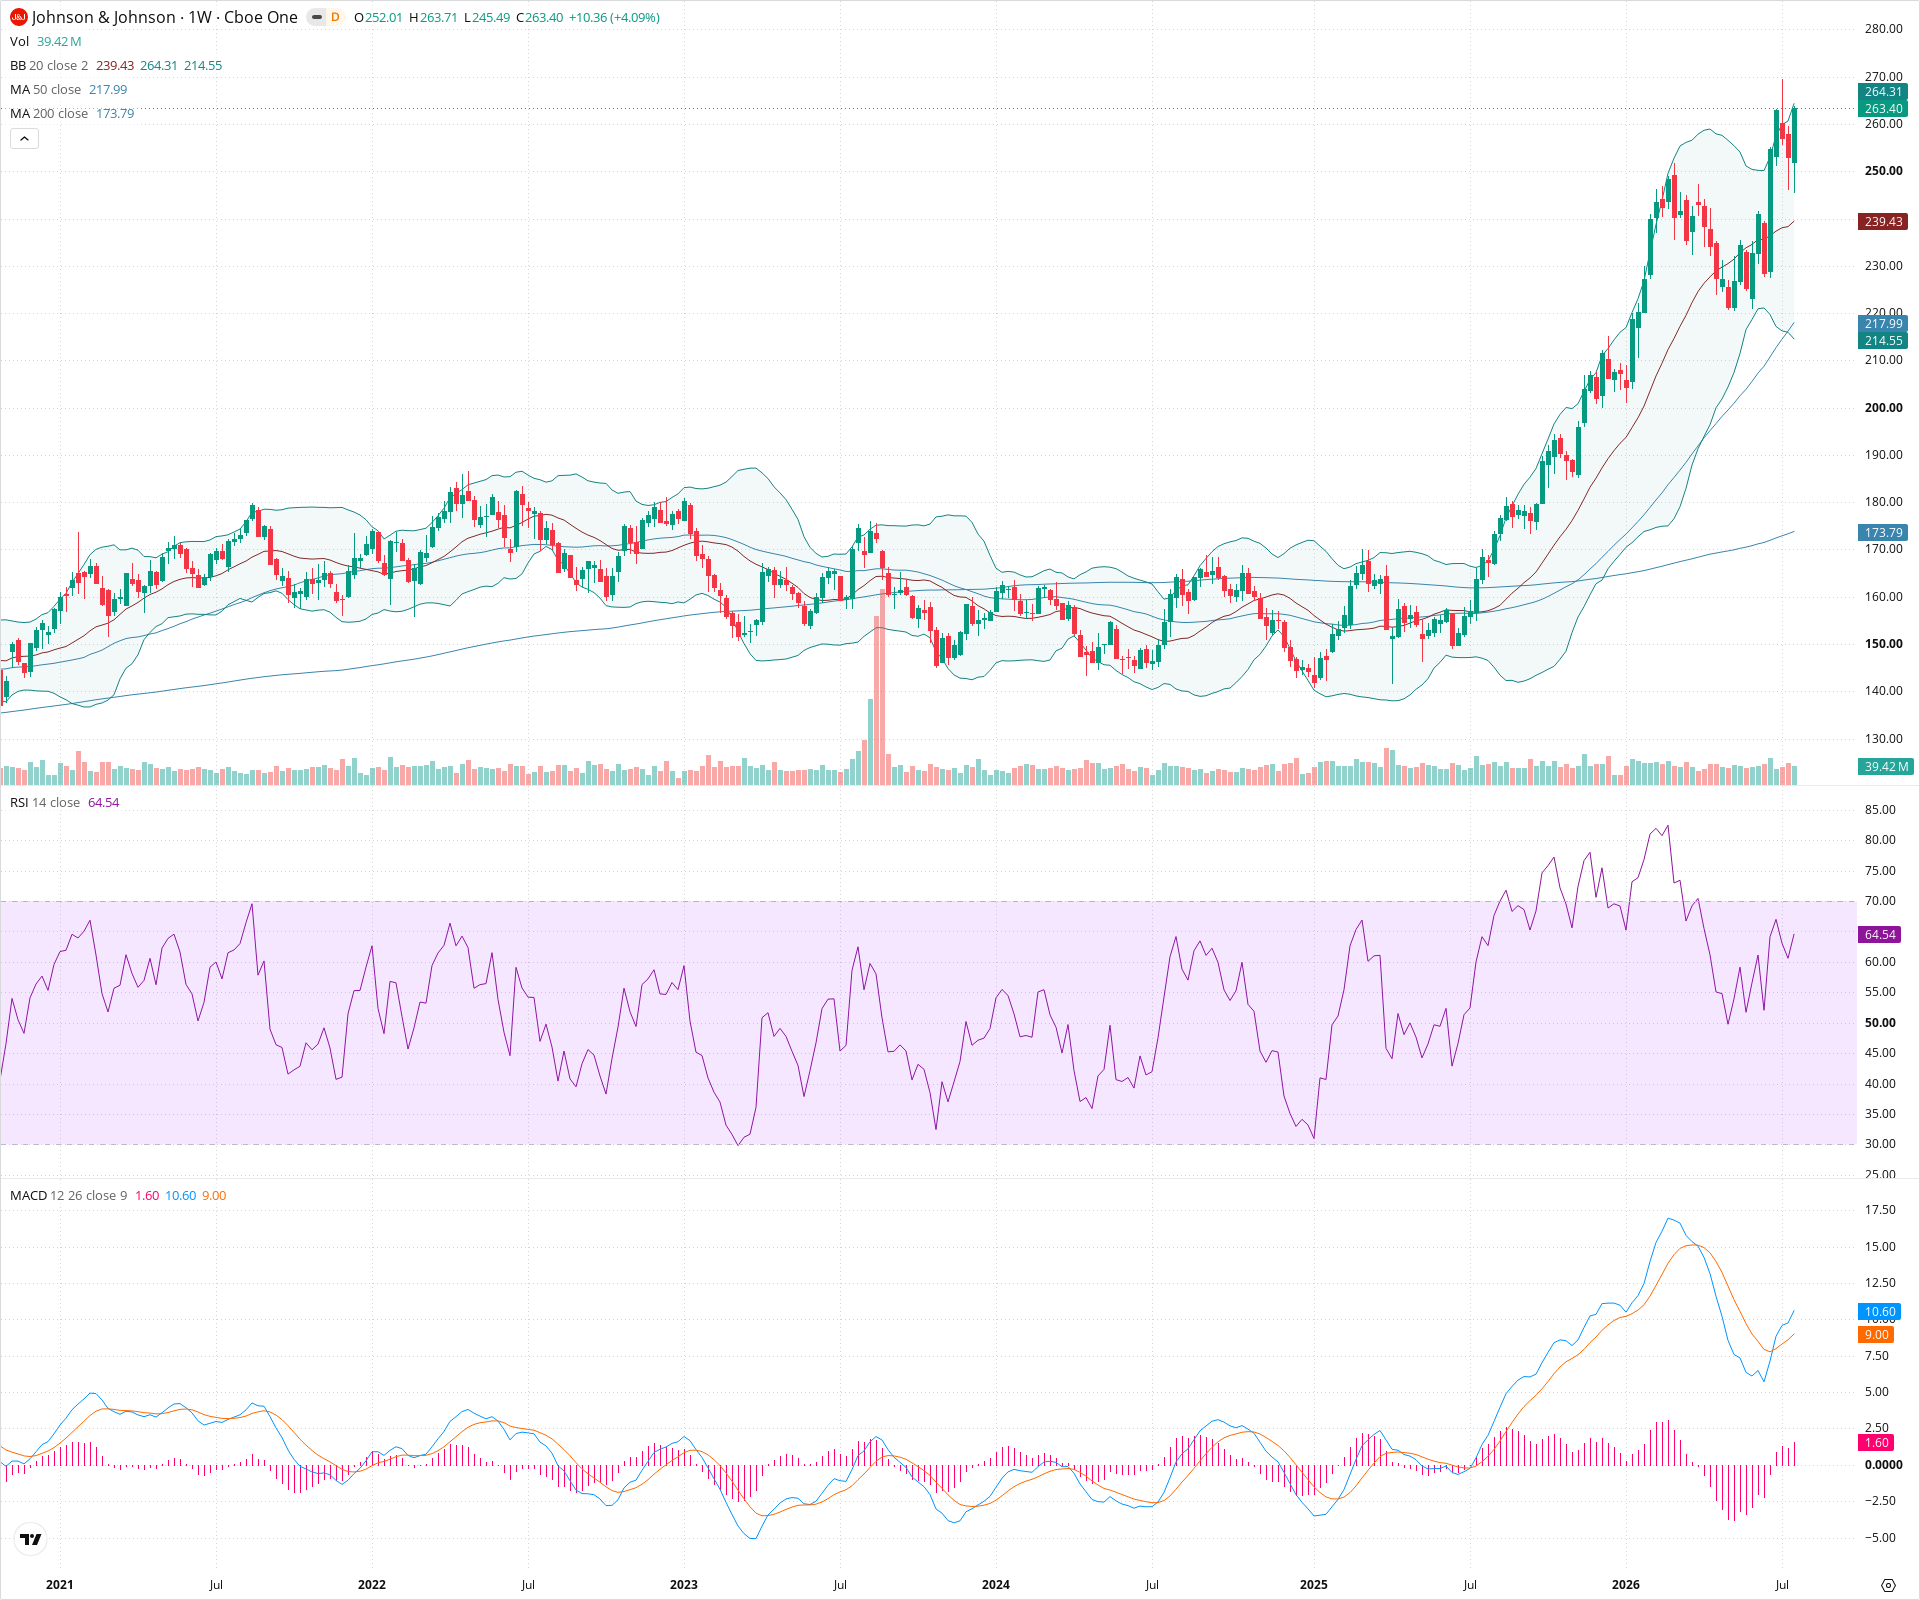
The weekly chart illustrates a dominant, long-term uptrend with price accelerating away from key moving averages. While near-term momentum shows slight cooling via MACD histogram contraction as price digests recent gains, the overall structure remains heavily bullish. The current consolidation appears to be a healthy pause, and holding above the 240 support area keeps the primary bullish thesis intact for potential further upside.
Included In Lists
Related Tickers of Interest
JNJ Weekly Chart
Sentiment
Short-term Sentiment (days to weeks): Bullish
Price is consolidating near recent highs in a tight range just above a steeply rising 20-week moving average. Momentum indicators (RSI and MACD) remain firmly in bullish territory, suggesting a pause before potential continuation.
Long-term Sentiment (weeks to months): Bullish
A powerful, sustained long-term uptrend is evident, characterized by price trading well above both the rising 50-week and 200-week SMAs. The sequence of higher highs and higher lows over multiple years confirms a strong structural bull market.
Report Metadata
- Timeframe: weekly
- Generated at: 2026-07-25T09:04:20.199Z
- Model: gemini-3.1-pro-preview
Support Price Levels
| Level | Range | Strength | Notes |
|---|---|---|---|
| $240.00 | $235.00 - $245.00 | Strong | Dynamic support zone near the steeply rising 20-week moving average (middle Bollinger Band) and the bottom of the most recent minor pullback. |
| $215.00 | $210.00 - $220.00 | Strong | Major structural support at the previous multi-month consolidation zone and breakout level, now converging with the rising 50-week SMA. |
Resistance Price Levels
| Level | Range | Strength | Notes |
|---|---|---|---|
| $272.50 | $270.00 - $275.00 | Strong | The recent peak and all-time high zone where the latest parabolic rally phase stalled, creating immediate overhead supply. |
Potential Chart Patterns in Formation
| Strength | Pattern | Signal | Target | Details |
|---|---|---|---|---|
| Strong | Bull Flag / High Tight Flag | Bullish | N/A | Following a rapid, steep ascent from the 210 area, the price has spent recent weeks consolidating in a tight lateral range near the highs, characteristic of a continuation pattern in a strong uptrend. |
Frequently Asked Questions about JNJ
What is the current sentiment for JNJ?
The short-term sentiment for JNJ is currently Bullish because Price is consolidating near recent highs in a tight range just above a steeply rising 20-week moving average. Momentum indicators (RSI and MACD) remain firmly in bullish territory, suggesting a pause before potential continuation.. The long-term trend is classified as Bullish.
What are the key support levels for JNJ?
StockDips.AI has identified key support levels for JNJ at $240.00 and $215.00. These levels may represent potential accumulation zones where buying interest could emerge.
Is JNJ in a significant dip or a Value Dip right now?
JNJ has a Value Score of 21/100. It is not currently flagged as a significant dip in the Top Dips list. It is not listed as a Value Dip because the long-term sentiment or value-score threshold does not qualify.
View the full interactive analysis on StockDips.AI.