PG Daily Technical Analysis
Procter & Gamble
Consumer staples leader (Tide, Pampers, Gillette, Olay)
PG Technical Analysis Summary
PG is currently experiencing a period of compression, trapped between the support of the 50-day moving average and the resistance of the 200-day moving average. Both price action and momentum oscillators like RSI and MACD are failing to show a clear directional bias, reflecting market indecision. A decisive breakout above the 200-day SMA or a breakdown below the 50-day SMA will likely dictate the next significant trend for long-term investors.
Included In Lists
Related Tickers of Interest
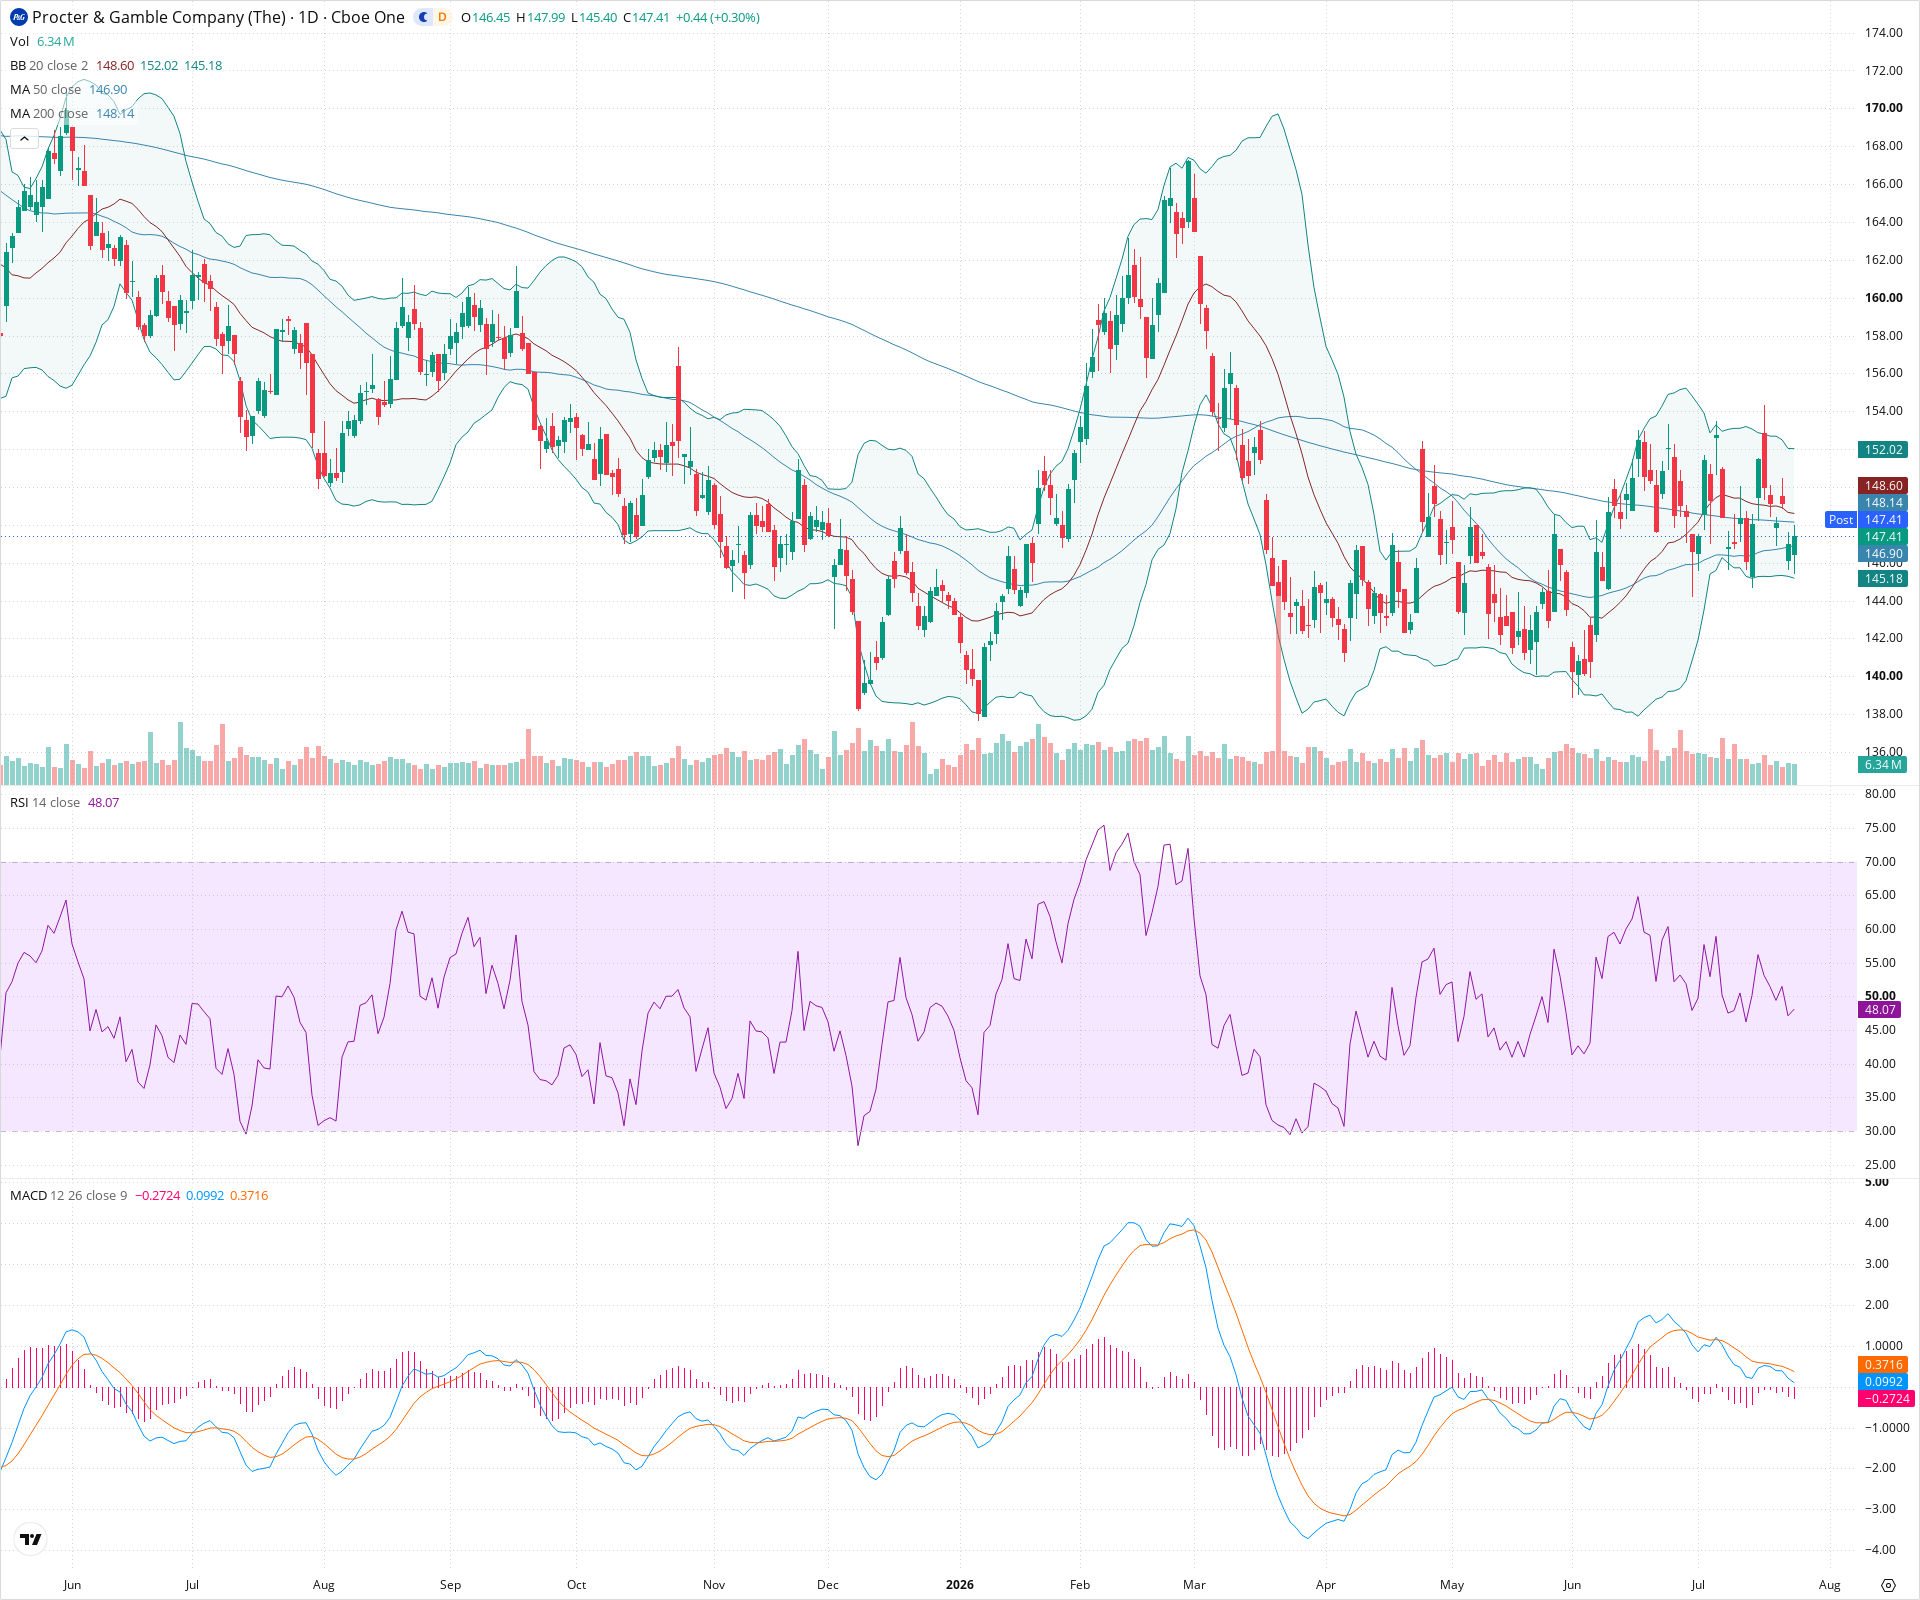
PG Daily Chart
Sentiment
Short-term Sentiment (days to weeks): Neutral
Price is currently consolidating in a tight range between the rising 50-day SMA and the flat 200-day SMA. RSI is hovering near the 50 midpoint, and while MACD shows a recent bearish crossover, the histogram is relatively shallow, indicating a lack of strong directional momentum.
Long-term Sentiment (weeks to months): Neutral
The long-term trend appears to be a wide, choppy consolidation. Although the price is below the 200-day SMA, that moving average is flattening out, and the price is being supported by higher lows and a rising 50-day SMA, suggesting a transitional phase rather than a sustained downtrend.
Report Metadata
- Timeframe: daily
- Generated at: 2026-07-24T21:12:56.602Z
- Model: gemini-3.1-pro-preview
Support Price Levels
| Level | Range | Strength | Notes |
|---|---|---|---|
| $145.95 | $145.00 - $146.90 | Strong | A key support zone formed by recent swing lows, the rising 50-day SMA, and the lower Bollinger Band. |
| $139.00 | $138.00 - $140.00 | Strong | Major structural support zone established by significant double bottoms observed earlier in the charted period. |
Resistance Price Levels
| Level | Range | Strength | Notes |
|---|---|---|---|
| $148.50 | $148.00 - $149.00 | Strong | Immediate resistance cluster formed by the 20-day SMA and the 200-day SMA, which has capped recent upside attempts. |
| $152.50 | $152.00 - $153.00 | Weak | Recent swing high area corresponding with the upper Bollinger Band. |
Potential Chart Patterns in Formation
| Strength | Pattern | Signal | Target | Details |
|---|---|---|---|---|
| Strong | Moving Average Squeeze / Consolidation | Neutral | N/A | The price action is becoming increasingly compressed between the 50-day SMA acting as support and the 200-day SMA acting as resistance, indicating an impending volatility expansion once a breakout occurs. |
Frequently Asked Questions about PG
What is the current sentiment for PG?
The short-term sentiment for PG is currently Neutral because Price is currently consolidating in a tight range between the rising 50-day SMA and the flat 200-day SMA. RSI is hovering near the 50 midpoint, and while MACD shows a recent bearish crossover, the histogram is relatively shallow, indicating a lack of strong directional momentum.. The long-term trend is classified as Neutral.
What are the key support levels for PG?
StockDips.AI has identified key support levels for PG at $145.95 and $139.00. These levels may represent potential accumulation zones where buying interest could emerge.
Is PG in a significant dip or a Value Dip right now?
PG has a Value Score of 43/100. It is not currently flagged as a significant dip in the Top Dips list. It is not listed as a Value Dip because the long-term sentiment or value-score threshold does not qualify.
View the full interactive analysis on StockDips.AI.