MSFT Weekly Technical Analysis
Microsoft Corporation
Develops software, cloud computing, and AI tools including Windows, Office, and Azure.
MSFT Technical Analysis Summary
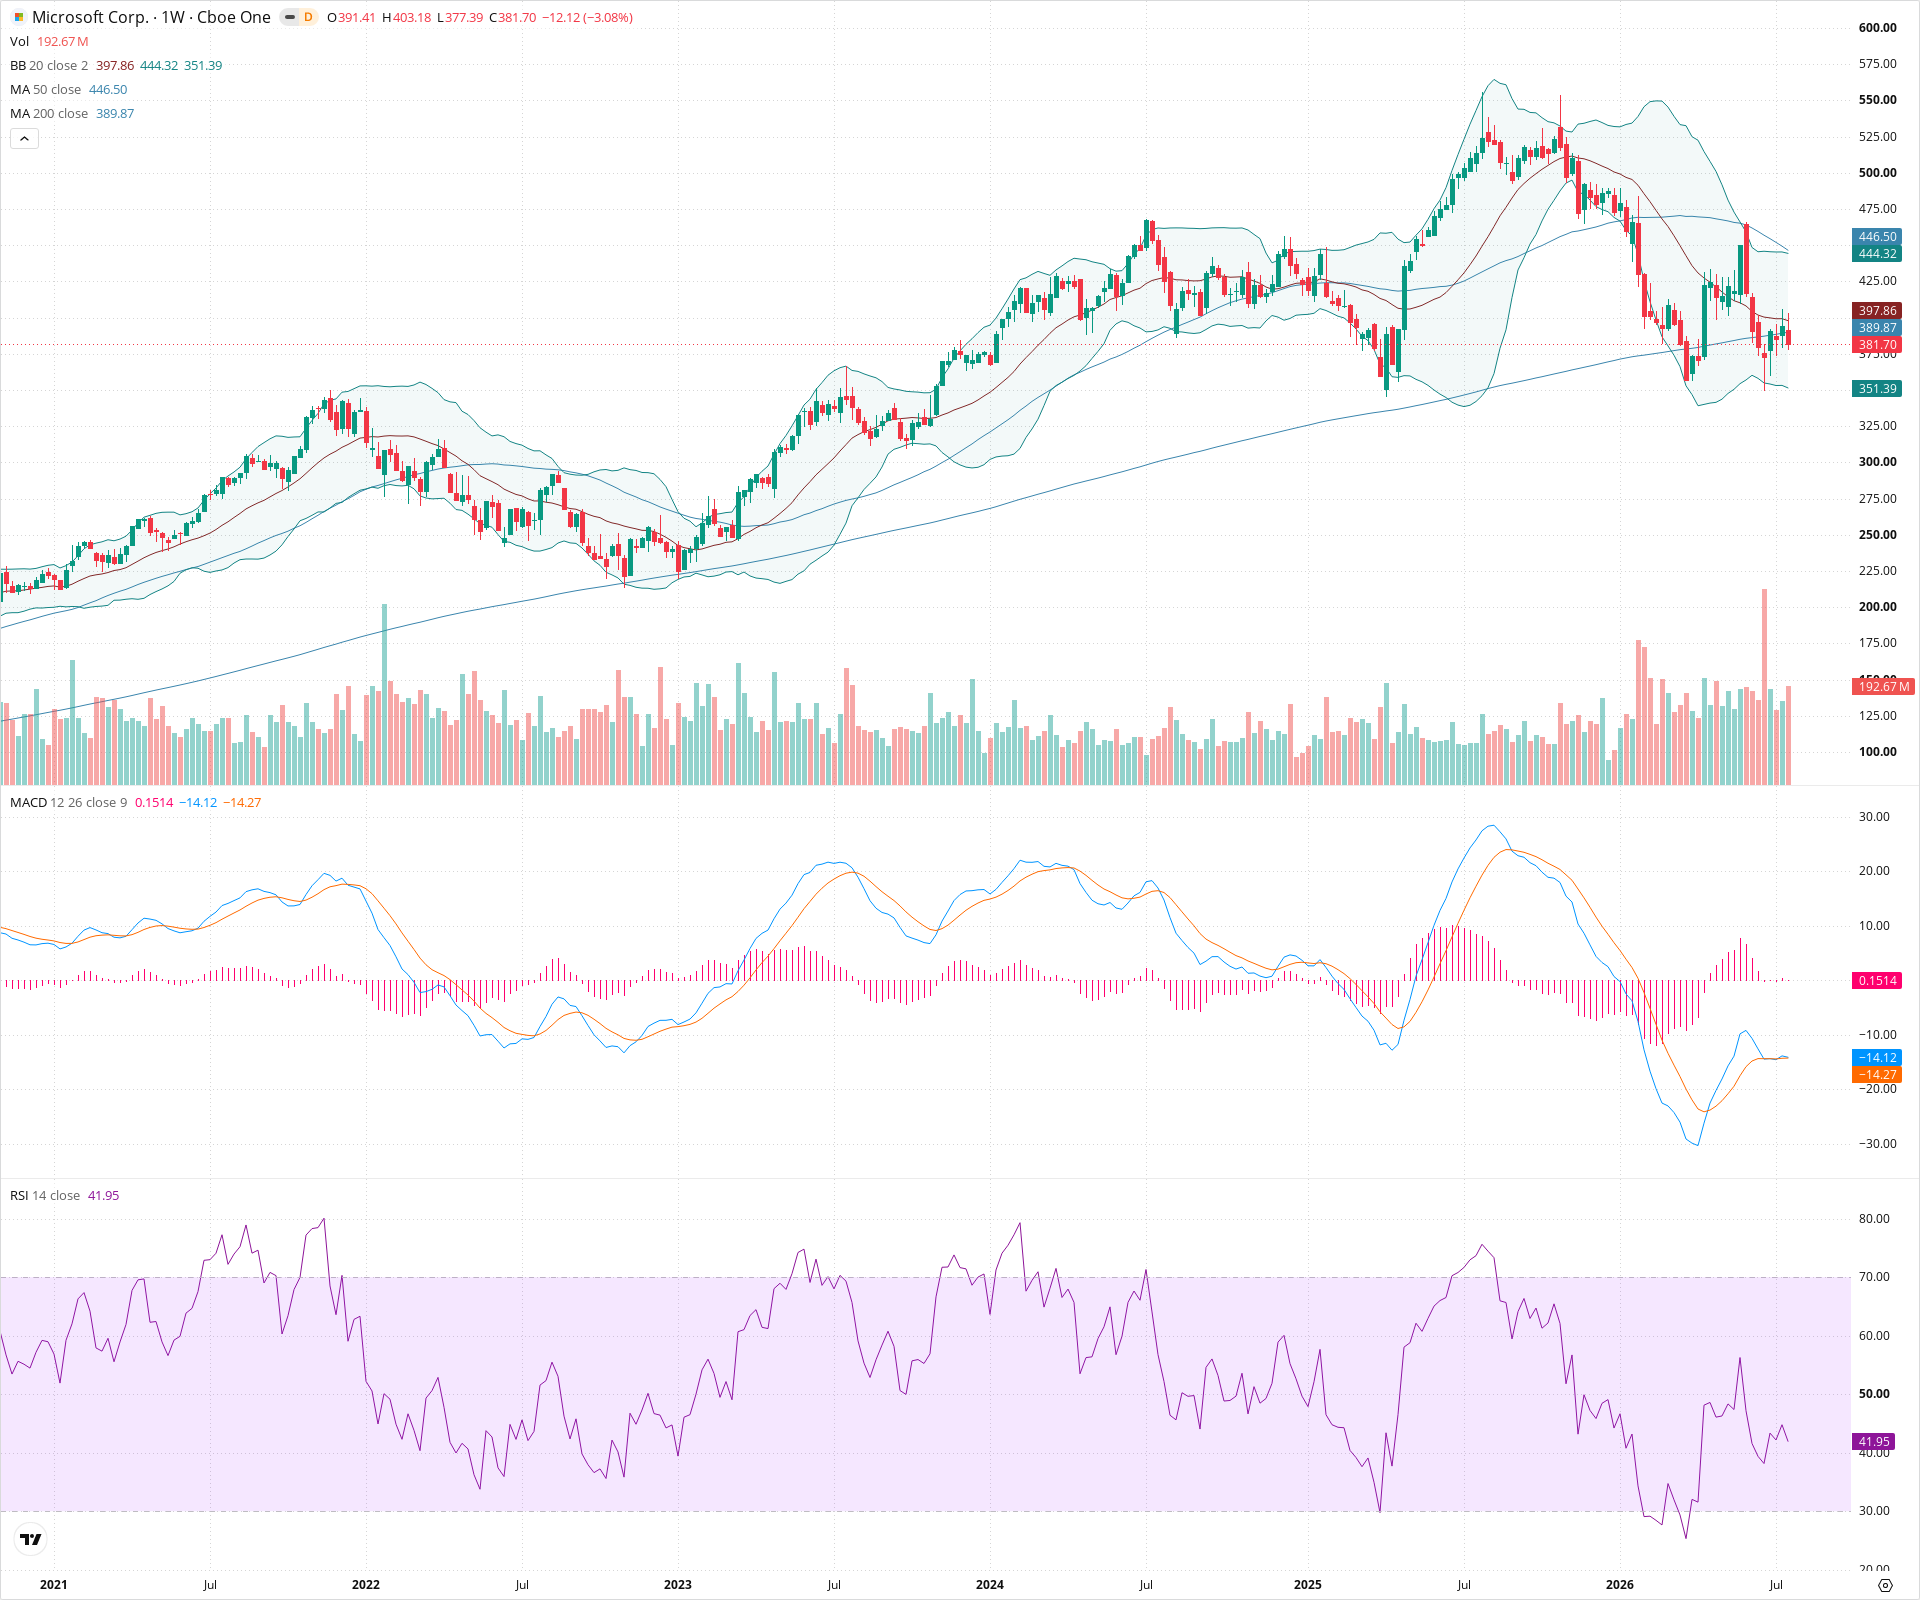
MSFT is in a long-term structural uptrend that recently underwent a deep, multi-month correction. The stock is currently consolidating around a major structural support zone spanning 370-390, which coincides with the rising 200-week SMA. Short-term momentum remains neutral to slightly bearish as indicated by the MACD and price remaining below the 50-week SMA, but long-term sentiment holds bullish as long as this key support zone is defended.
Included In Lists
Related Tickers of Interest
MSFT Weekly Chart
Sentiment
Short-term Sentiment (days to weeks): Neutral
Price is consolidating after a significant pullback, finding support near the 200-week SMA. The weekly MACD remains negative, but the histogram suggests downside momentum is slowing. RSI is hovering in the mid-40s, reflecting indecision.
Long-term Sentiment (weeks to months): Bullish
The long-term uptrend remains intact despite a recent large correction. Price action has pulled back to the rising 200-week SMA, a major structural support area. The 50-week SMA is still above the 200-week SMA.
Report Metadata
- Timeframe: weekly
- Generated at: 2026-07-25T09:01:34.698Z
- Model: gemini-3.1-pro-preview
Support Price Levels
| Level | Range | Strength | Notes |
|---|---|---|---|
| $380.00 | $370.00 - $390.00 | Strong | Major confluence zone. Corresponds to recent swing lows, structural support from late 2023 / early 2024, and the rising 200-week SMA. |
| $325.00 | $315.00 - $335.00 | Strong | Significant prior breakout and consolidation area from mid-2023. |
Resistance Price Levels
| Level | Range | Strength | Notes |
|---|---|---|---|
| $445.00 | $440.00 - $450.00 | Strong | Near-term overhead resistance where price recently failed, aligning with the 50-week SMA. |
| $500.00 | $490.00 - $510.00 | Weak | Lower high established during the initial bounce from the major peak. |
| $562.50 | $550.00 - $575.00 | Strong | All-time high peak area. |
Potential Chart Patterns in Formation
| Strength | Pattern | Signal | Target | Details |
|---|---|---|---|---|
| Strong | Pullback to Long-Term Support | Bullish | N/A | After a massive run-up to new highs, the stock experienced a deep multi-month correction. Price has now stabilized near the rising 200-week moving average and prior structural support levels. |
Frequently Asked Questions about MSFT
What is the current sentiment for MSFT?
The short-term sentiment for MSFT is currently Neutral because Price is consolidating after a significant pullback, finding support near the 200-week SMA. The weekly MACD remains negative, but the histogram suggests downside momentum is slowing. RSI is hovering in the mid-40s, reflecting indecision.. The long-term trend is classified as Bullish.
What are the key support levels for MSFT?
StockDips.AI has identified key support levels for MSFT at $380.00 and $325.00. These levels may represent potential accumulation zones where buying interest could emerge.
Is MSFT in a significant dip or a Value Dip right now?
MSFT has a Value Score of 63/100. It is not currently flagged as a significant dip in the Top Dips list. It is not listed as a Value Dip because the long-term sentiment or value-score threshold does not qualify.
View the full interactive analysis on StockDips.AI.