NBIS Daily Technical Analysis
Nebius Group
technology company specializing in infrastructure for the artificial intelligence (AI) industry
NBIS Technical Analysis Summary
NBIS has experienced a massive run-up followed by a severe and sharp correction, indicative of a bursting parabolic move. Short-term momentum is heavily bearish, characterized by a loss of key near-term moving averages, elevated selling volume, and accelerating negative MACD. While long-term investors may note the price remains above a rising 200-day SMA, extreme caution is warranted in the near term until selling pressure abates and a visible base or reversal pattern forms.
Included In Lists
Related Tickers of Interest
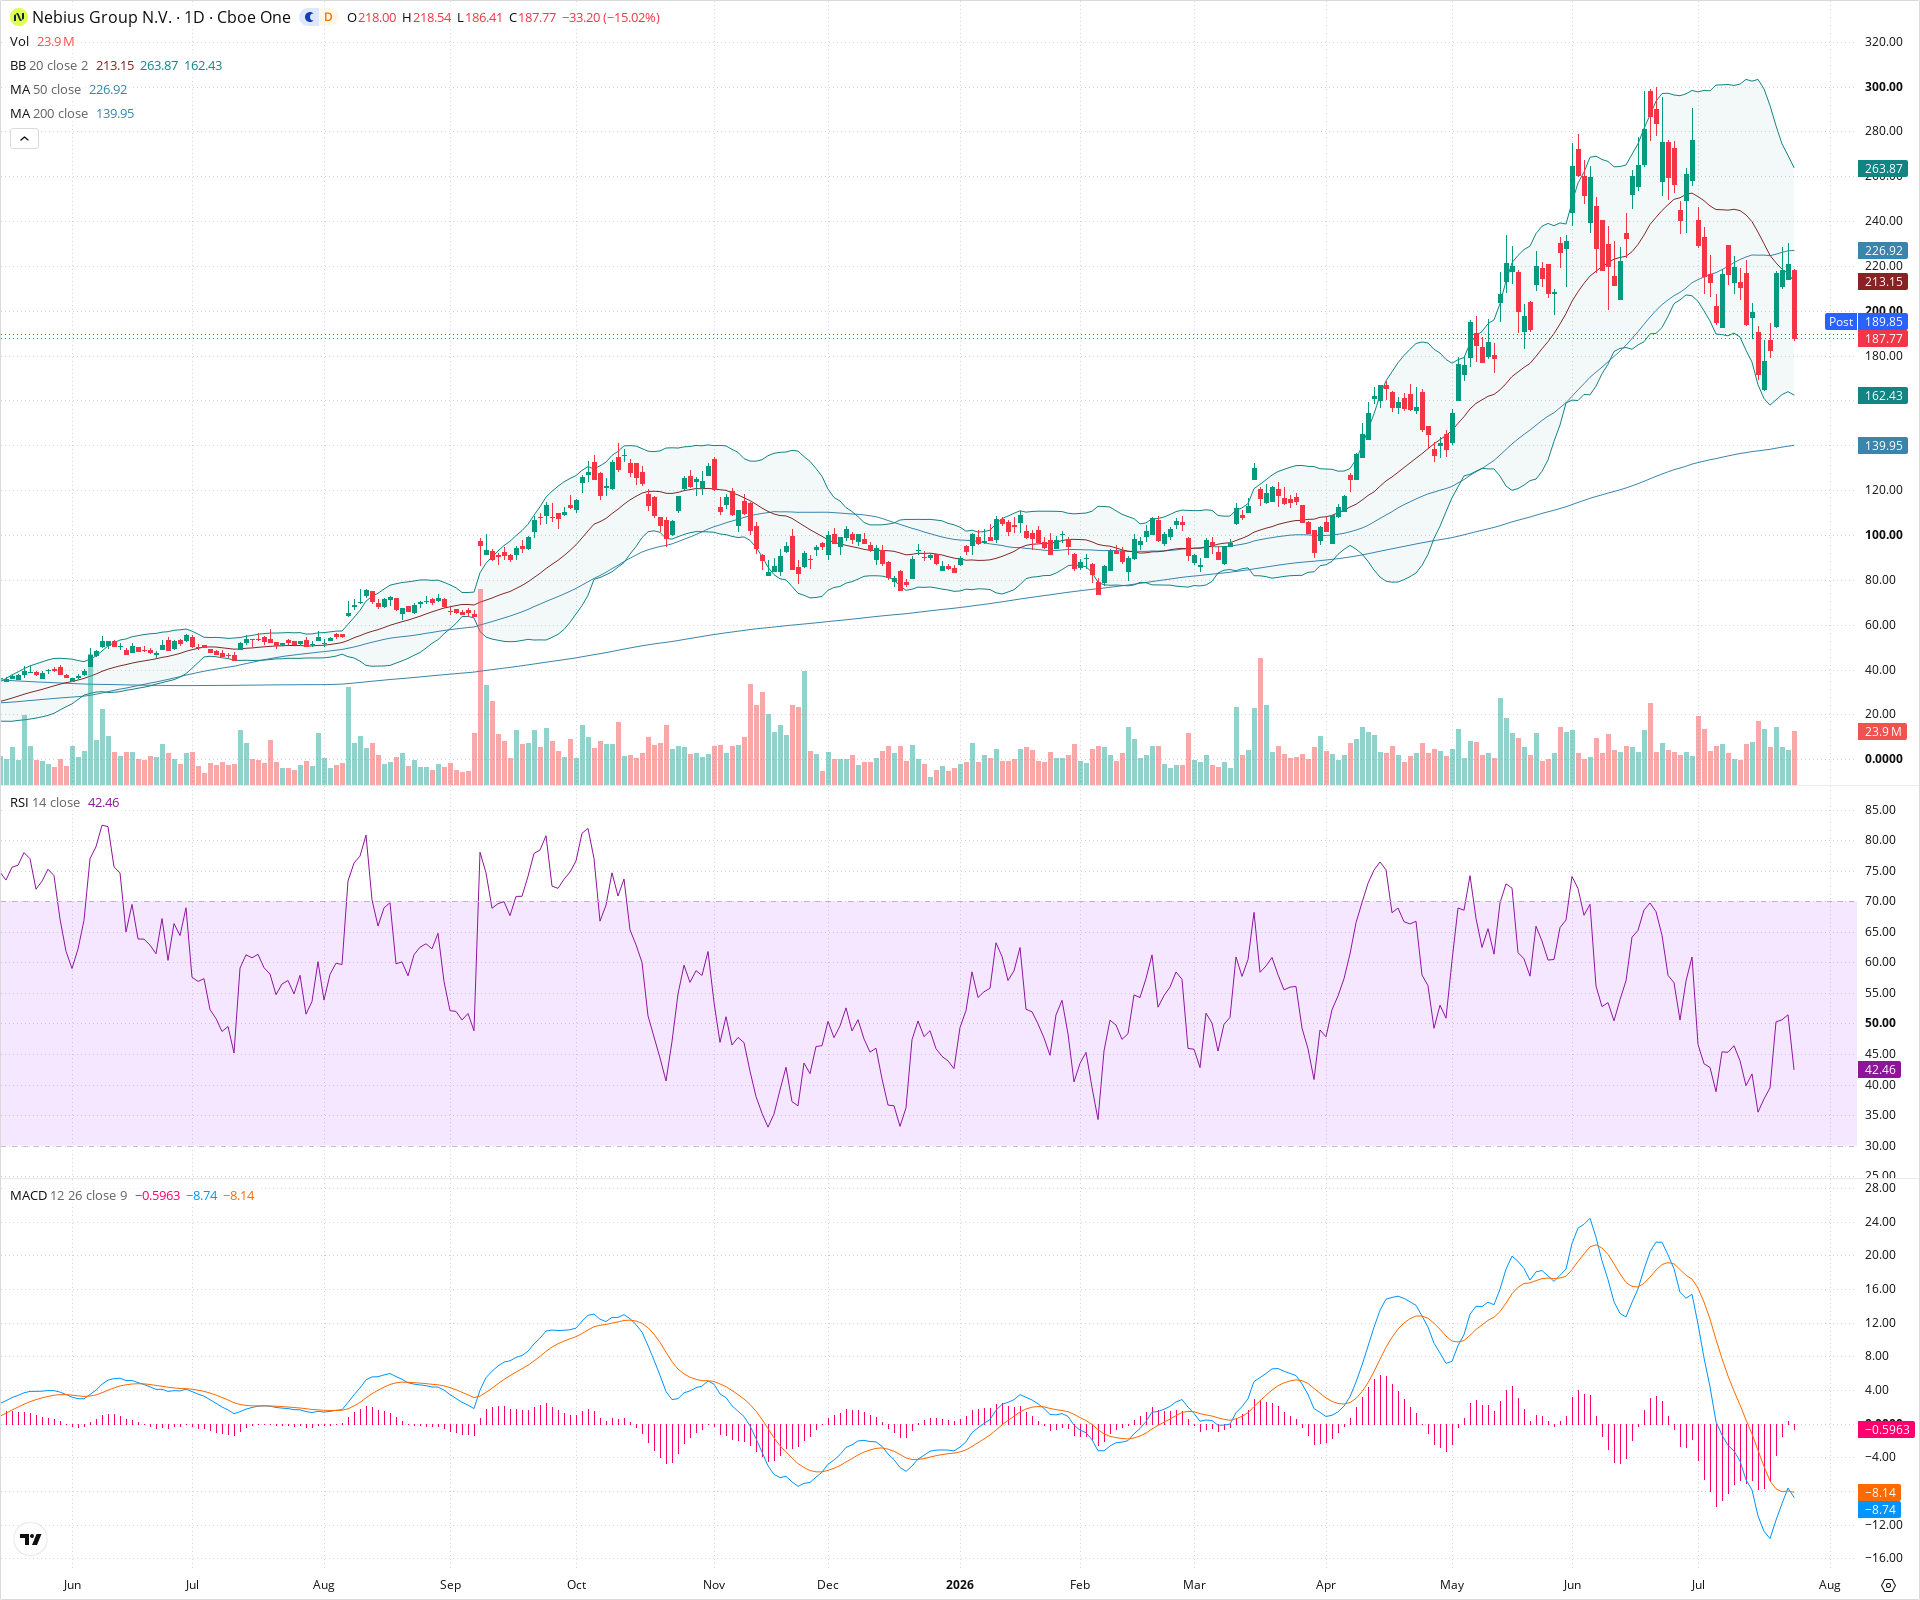
NBIS Daily Chart
Sentiment
Short-term Sentiment (days to weeks): Bearish
Price has suffered a steep, high-volume decline, breaking definitively below both the 20-day and 50-day SMAs. It is currently riding the lower Bollinger Band. MACD shows a strong bearish crossover with an expanding negative histogram, and RSI is trending downwards sharply, confirming intense selling pressure.
Long-term Sentiment (weeks to months): Bullish
Despite the severe recent correction, the overarching long-term trend structure remains intact as the price is still significantly above a steadily rising 200-day SMA.
Report Metadata
- Timeframe: daily
- Generated at: 2026-07-24T21:07:28.834Z
- Model: gemini-3.1-pro-preview
Support Price Levels
| Level | Range | Strength | Notes |
|---|---|---|---|
| $165.00 | $160.00 - $170.00 | Weak | A minor prior consolidation zone on the way up before the parabolic acceleration. |
| $140.00 | $135.00 - $145.00 | Strong | Major structural support aligning with the rising 200-day SMA (currently near 140) and prior swing lows from earlier in the year. |
Resistance Price Levels
| Level | Range | Strength | Notes |
|---|---|---|---|
| $212.50 | $210.00 - $215.00 | Strong | Immediate resistance area corresponding to the recently broken 20-day SMA. |
| $227.50 | $225.00 - $230.00 | Strong | Key resistance zone at the 50-day SMA, which the price sliced through during the recent drop. |
| $267.50 | $260.00 - $275.00 | Strong | Significant resistance near the recent lower highs formed just before the most intense wave of selling began. |
Potential Chart Patterns in Formation
| Strength | Pattern | Signal | Target | Details |
|---|---|---|---|---|
| Strong | Parabolic Breakdown | Bearish | N/A | The chart displays a nearly vertical, parabolic ascent followed by an equally sharp, high-volume collapse, indicating a rapid unwinding of speculative momentum. |
| Strong | Moving Average Breakdown | Bearish | N/A | Price has decisively broken below both the 20-period and 50-period moving averages on strong downward momentum. |
Frequently Asked Questions about NBIS
What is the current sentiment for NBIS?
The short-term sentiment for NBIS is currently Bearish because Price has suffered a steep, high-volume decline, breaking definitively below both the 20-day and 50-day SMAs. It is currently riding the lower Bollinger Band. MACD shows a strong bearish crossover with an expanding negative histogram, and RSI is trending downwards sharply, confirming intense selling pressure.. The long-term trend is classified as Bullish.
What are the key support levels for NBIS?
StockDips.AI has identified key support levels for NBIS at $165.00 and $140.00. These levels may represent potential accumulation zones where buying interest could emerge.
Is NBIS in a significant dip or a Value Dip right now?
NBIS has a Value Score of 52/100. It is not currently flagged as a significant dip in the Top Dips list. It is not listed as a Value Dip because the long-term sentiment or value-score threshold does not qualify.
View the full interactive analysis on StockDips.AI.