CIFR Daily Technical Analysis
Cipher Mining Inc
U.S. Bitcoin mining company operating large-scale data centers.
CIFR Technical Analysis Summary
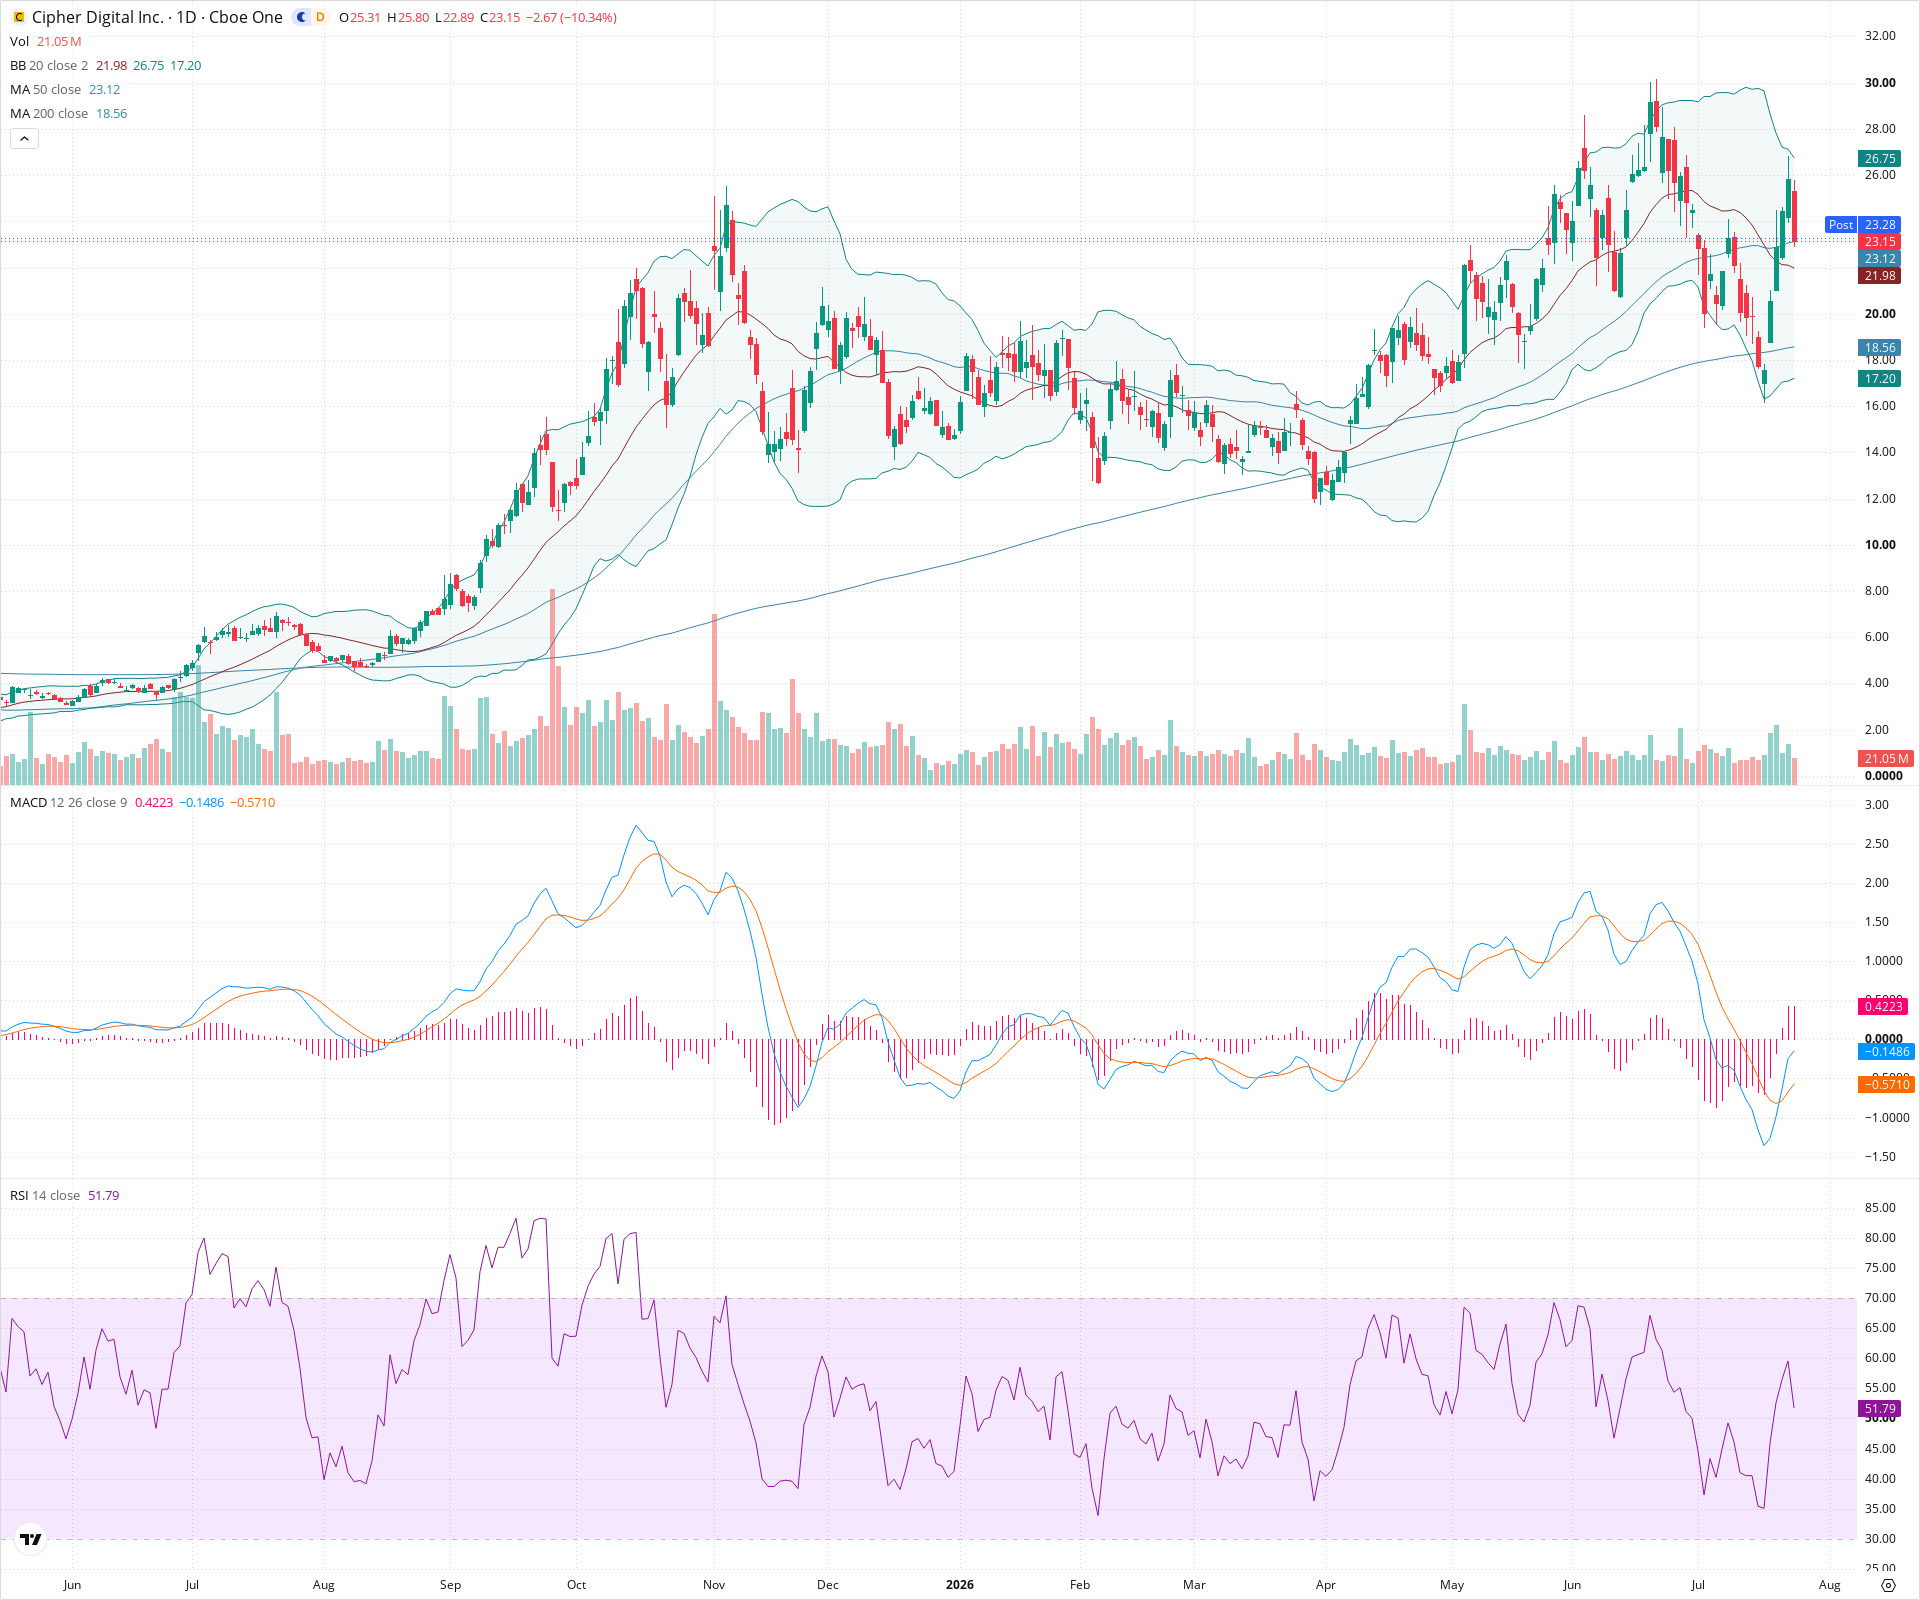
CIFR has established a strong long-term uptrend, evidenced by price trending above rising 50 and 200-day moving averages. However, in the short term, the stock is experiencing a sharp pullback after failing to hold the 30.00 level. Downward momentum is confirmed by a bearish MACD crossover and a steep drop in RSI. Investors may look for the price to find support around the low 20s before the primary bullish trend can resume.
Included In Lists
Related Tickers of Interest
CIFR Daily Chart
Sentiment
Short-term Sentiment (days to weeks): Bearish
Price recently rejected from resistance near 30.00, breaking below the 20-day SMA, with a steep down candle. MACD shows a fresh bearish crossover with expanding negative histogram momentum, and RSI has turned sharply downward from overbought levels, currently approaching the midline.
Long-term Sentiment (weeks to months): Bullish
The broader trend remains intact with the 50-day SMA above the 200-day SMA, and price is still well above the long-term 200-day moving average. The overall structure is a series of higher highs and higher lows.
Report Metadata
- Timeframe: daily
- Generated at: 2026-07-24T21:08:23.101Z
- Model: gemini-3.1-pro-preview
Support Price Levels
| Level | Range | Strength | Notes |
|---|---|---|---|
| $20.50 | $20.00 - $21.00 | Strong | Previous swing low consolidation zone in late June/early July, aligning closely with the lower Bollinger Band. |
| $17.00 | $16.50 - $17.50 | Strong | Major prior support level in April, aligning roughly with the current 200-day SMA. |
Resistance Price Levels
| Level | Range | Strength | Notes |
|---|---|---|---|
| $27.00 | $26.50 - $27.50 | Weak | Recent consolidation/pullback zone before the final push to 30; near the 20-day SMA. |
| $30.25 | $29.50 - $31.00 | Strong | Recent significant swing high peak where price was sharply rejected. |
Potential Chart Patterns in Formation
| Strength | Pattern | Signal | Target | Details |
|---|---|---|---|---|
| Strong | Bearish Pullback | Bearish | $20.50 | After a strong vertical rally to 30.00, price has broken near-term support and the 20-SMA, indicating a deeper mean-reversion move is underway. |
Frequently Asked Questions about CIFR
What is the current sentiment for CIFR?
The short-term sentiment for CIFR is currently Bearish because Price recently rejected from resistance near 30.00, breaking below the 20-day SMA, with a steep down candle. MACD shows a fresh bearish crossover with expanding negative histogram momentum, and RSI has turned sharply downward from overbought levels, currently approaching the midline.. The long-term trend is classified as Bullish.
What are the key support levels for CIFR?
StockDips.AI has identified key support levels for CIFR at $20.50 and $17.00. These levels may represent potential accumulation zones where buying interest could emerge.
Is CIFR in a significant dip or a Value Dip right now?
CIFR has a Value Score of 59/100. It is not currently flagged as a significant dip in the Top Dips list. It is not listed as a Value Dip because the long-term sentiment or value-score threshold does not qualify.
View the full interactive analysis on StockDips.AI.