NFLX Weekly Technical Analysis
Netflix Inc
Leading video streaming service producing and distributing original and licensed content.
NFLX Technical Analysis Summary
NFLX is trapped in a severe, long-term secular downtrend following the breakdown of a massive multi-year topping formation. The recent failure to hold above the critical 200-week SMA on expanding negative MACD momentum confirms extreme long-term bearishness. While the RSI is approaching oversold territory suggesting a potential short-term bounce, the dominant structure remains heavily skewed to the downside until significant base-building occurs.
Included In Lists
Related Tickers of Interest
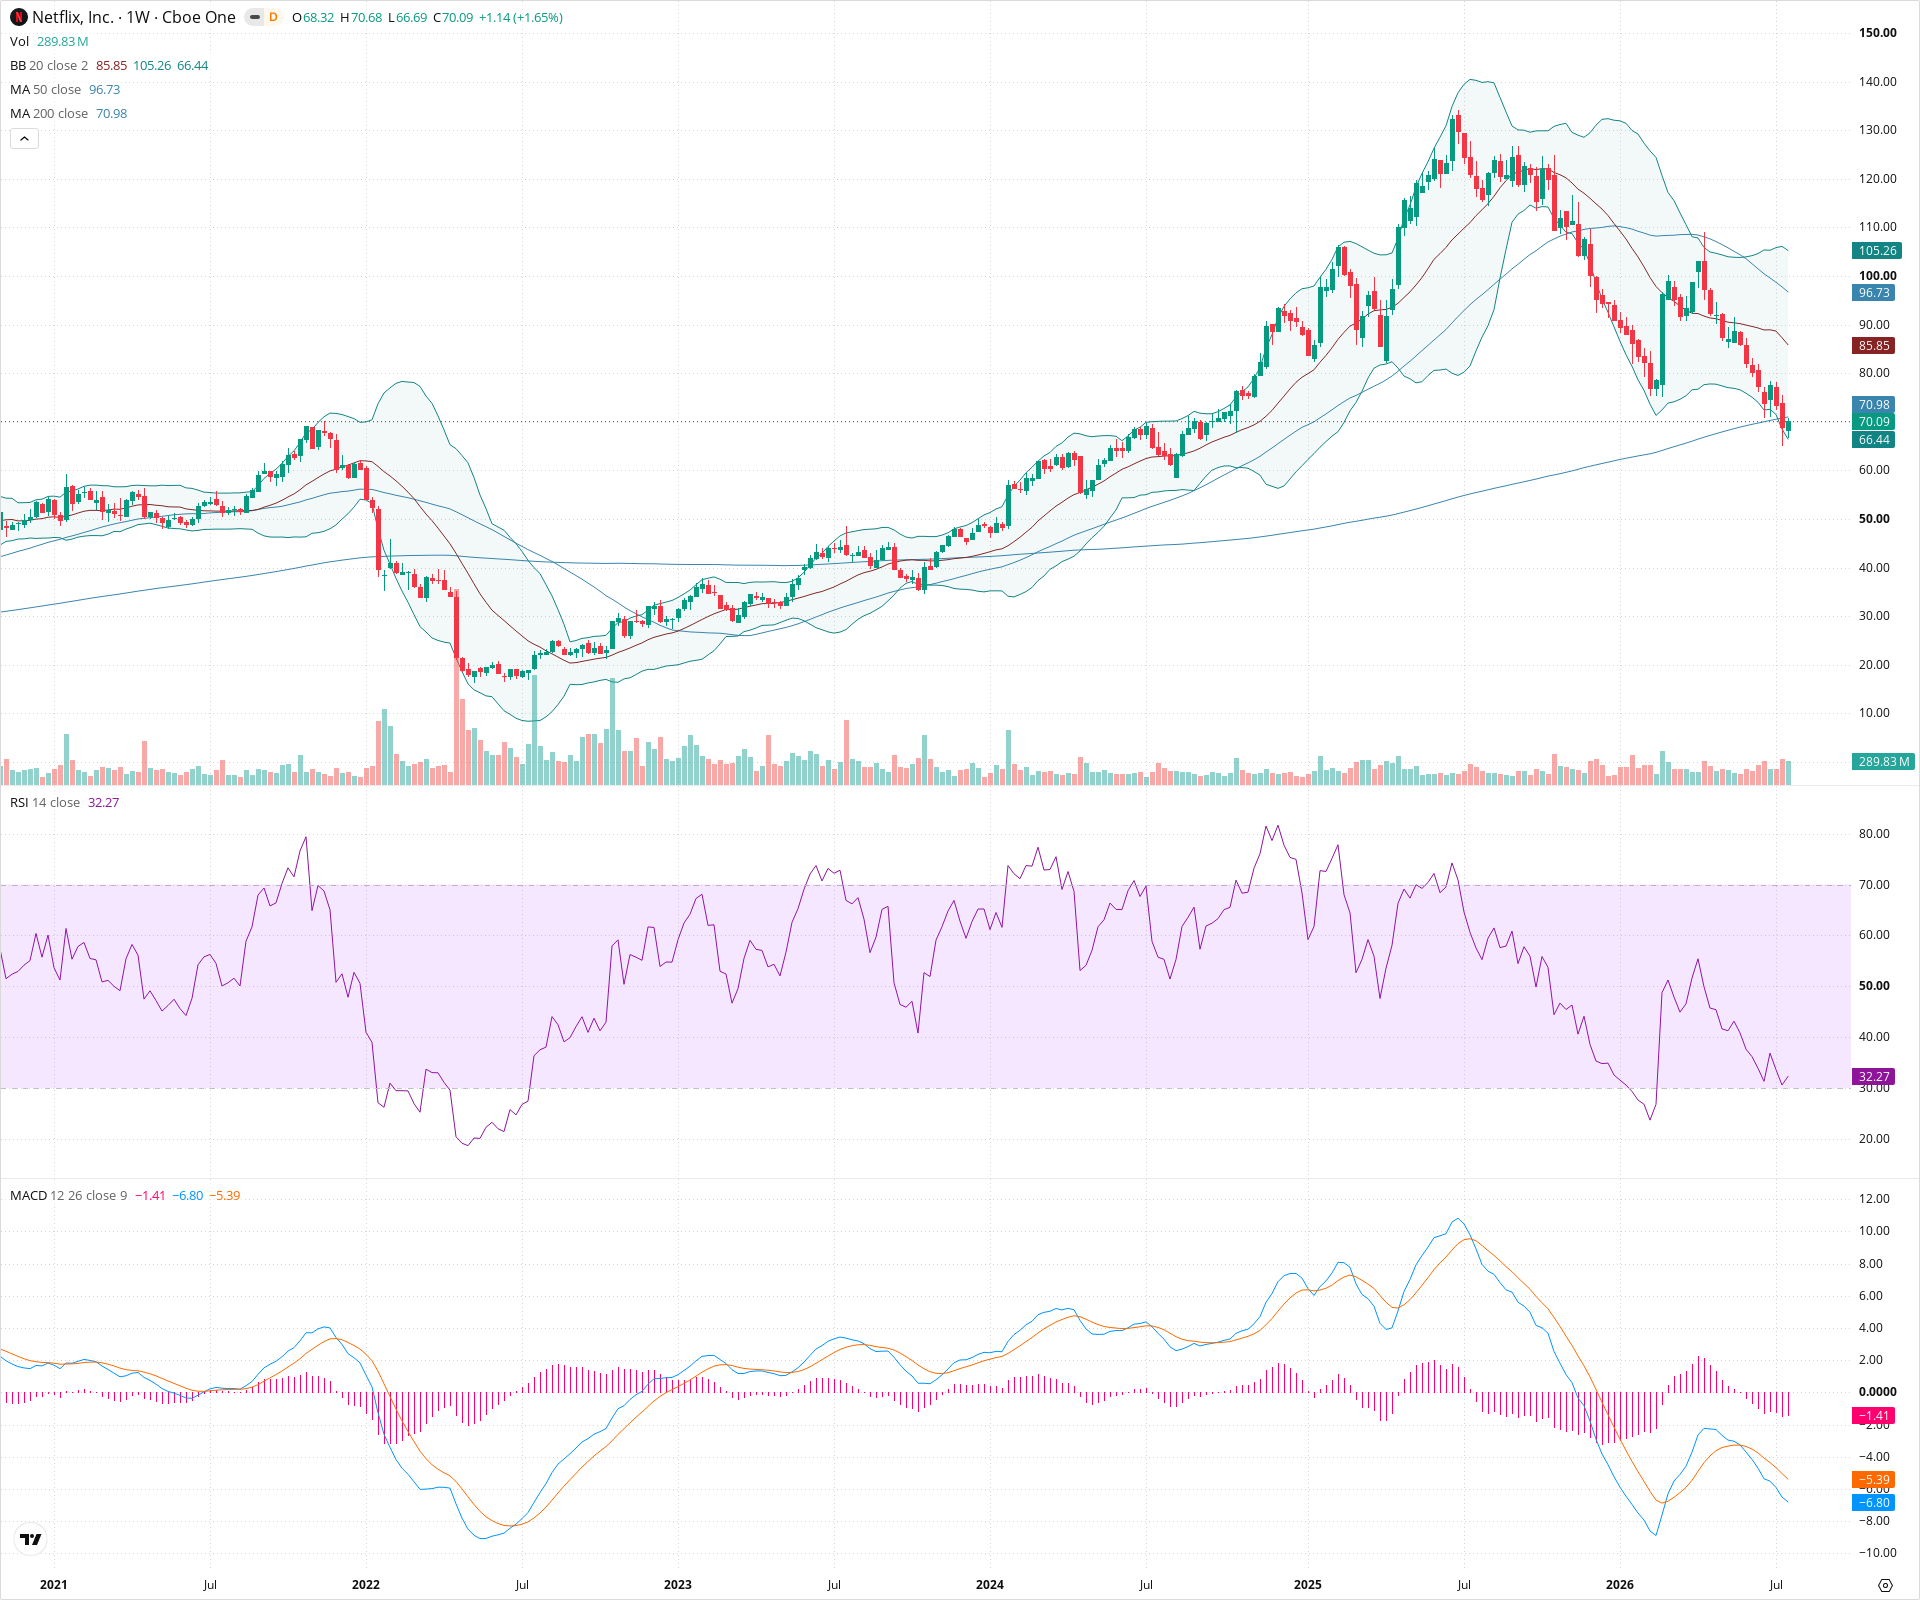
NFLX Weekly Chart
Sentiment
Short-term Sentiment (days to weeks): Bearish
Price is in a steep waterfall decline, riding the lower Bollinger Band downward, with MACD accelerating deep into negative territory and the 20-week SMA sloping sharply downward.
Long-term Sentiment (weeks to months): Bearish
The chart displays a massive structural top followed by a severe breakdown. Price has decisively lost the 50-week SMA and is currently breaking below the critical 200-week SMA, signaling a long-term trend reversal.
Report Metadata
- Timeframe: weekly
- Generated at: 2026-07-25T09:03:42.898Z
- Model: gemini-3.1-pro-preview
Support Price Levels
| Level | Range | Strength | Notes |
|---|---|---|---|
| $66.50 | $65.00 - $68.00 | Weak | Immediate dynamic support near the lower Bollinger Band. |
| $50.00 | $48.00 - $52.00 | Strong | Major historical consolidation zone and structural support from previous years before the massive bull run. |
Resistance Price Levels
| Level | Range | Strength | Notes |
|---|---|---|---|
| $71.25 | $70.50 - $72.00 | Strong | The 200-week SMA, which was historical support and now acts as immediate structural resistance. |
| $85.50 | $84.00 - $87.00 | Strong | The descending 20-week SMA and the area of the most recent consolidation breakdown. |
| $98.00 | $96.00 - $100.00 | Strong | The steeply declining 50-week SMA and psychological round number resistance. |
Potential Chart Patterns in Formation
| Strength | Pattern | Signal | Target | Details |
|---|---|---|---|---|
| Strong | Macro Topping Formation / Head and Shoulders | Bearish | N/A | A massive multi-year topping pattern formed with a peak around 140. The breakdown below the neckline (roughly 100-110) triggered the current severe downtrend. |
| Strong | Waterfall Decline | Bearish | N/A | Price is exhibiting consecutive heavy bearish weekly candles with little to no retracement, characteristic of capitulation or a strong impulsive downtrend. |
Frequently Asked Questions about NFLX
What is the current sentiment for NFLX?
The short-term sentiment for NFLX is currently Bearish because Price is in a steep waterfall decline, riding the lower Bollinger Band downward, with MACD accelerating deep into negative territory and the 20-week SMA sloping sharply downward.. The long-term trend is classified as Bearish.
What are the key support levels for NFLX?
StockDips.AI has identified key support levels for NFLX at $66.50 and $50.00. These levels may represent potential accumulation zones where buying interest could emerge.
Is NFLX in a significant dip or a Value Dip right now?
NFLX has a Value Score of 46/100. It is not currently flagged as a significant dip in the Top Dips list. It is not listed as a Value Dip because the long-term sentiment or value-score threshold does not qualify.
View the full interactive analysis on StockDips.AI.