NKE Daily Technical Analysis
Nike Inc
Designs and markets athletic footwear, apparel, and equipment worldwide.
NKE Technical Analysis Summary
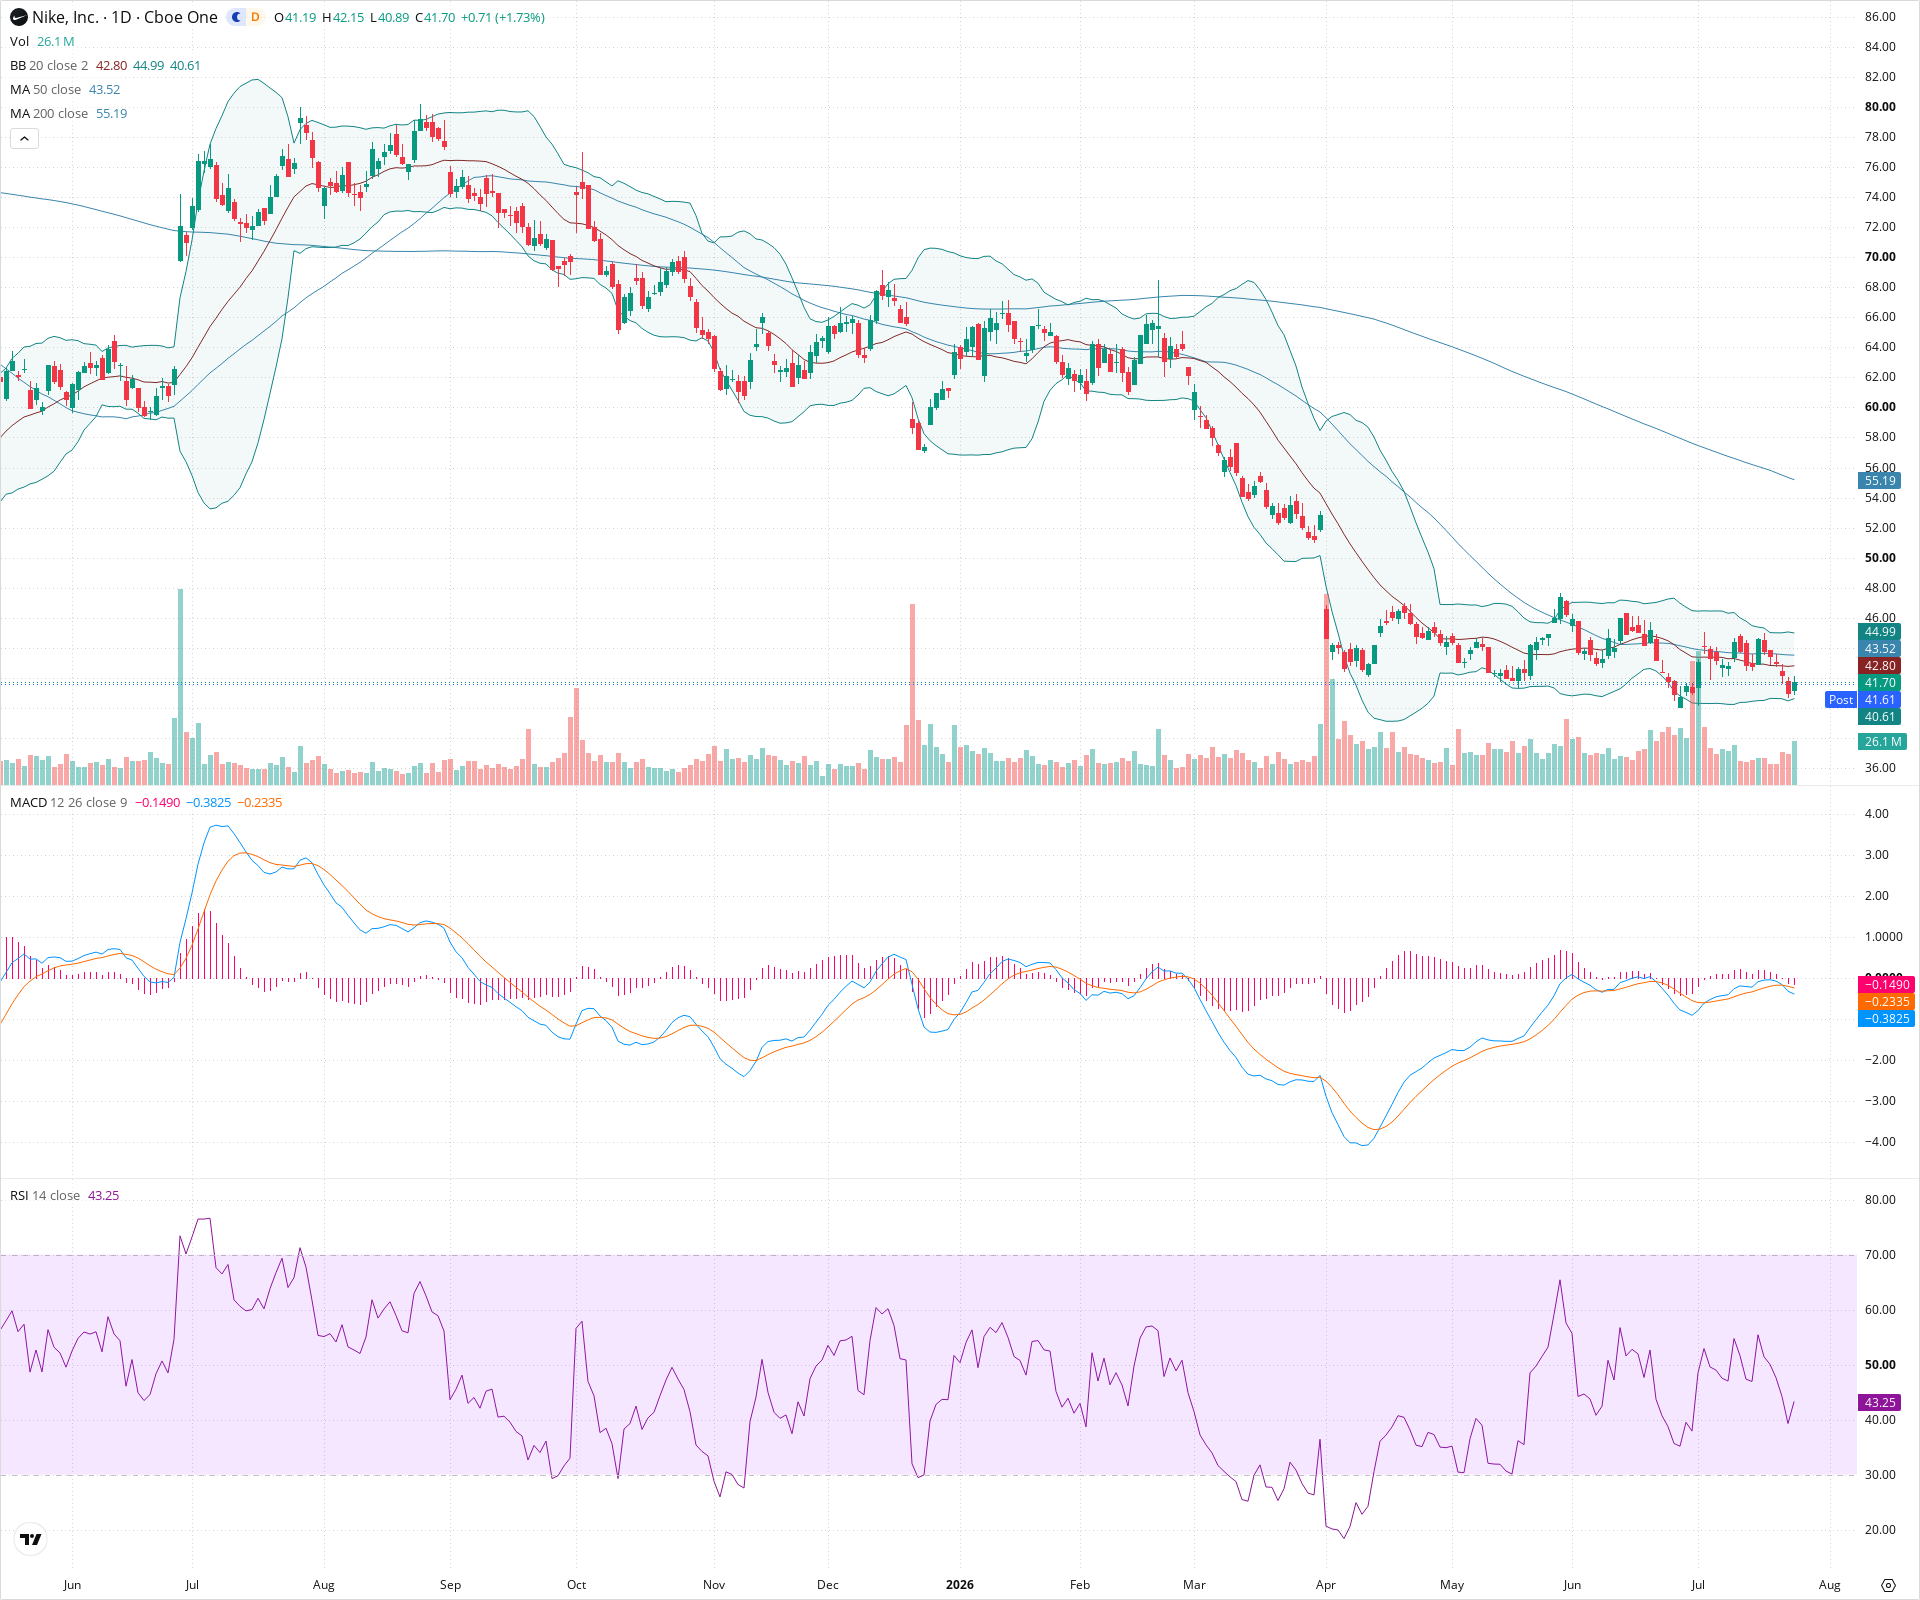
NKE exhibits a highly bearish technical posture across multiple timeframes. The long-term trend was shattered by a massive gap down, leaving overhead supply immense. In the short term, the stock is trapped in a lower consolidation range, with recent price action rejecting key moving average resistance, suggesting a higher probability of retesting the chart's structural lows rather than staging a meaningful recovery.
Included In Lists
Related Tickers of Interest
NKE Daily Chart
Sentiment
Short-term Sentiment (days to weeks): Bearish
Price recently failed at the 50-day SMA resistance and is now trending lower, breaking below the 20-day SMA. Momentum indicators are weak, with RSI falling back into the low 40s and MACD showing a bearish crossover with a negative histogram.
Long-term Sentiment (weeks to months): Bearish
The chart is dominated by a massive historical gap down. Price remains firmly entrenched in a primary downtrend, characterized by a 'death cross' alignment where the 50-day SMA is far below a steeply declining 200-day SMA.
Report Metadata
- Timeframe: daily
- Generated at: 2026-07-24T21:17:14.499Z
- Model: gemini-3.1-pro-preview
Support Price Levels
| Level | Range | Strength | Notes |
|---|---|---|---|
| $40.50 | $40.00 - $41.00 | Moderate | Near-term support zone formed by recent swing lows just above the absolute bottom. |
| $39.25 | $39.00 - $39.50 | Strong | The lowest point visible on the chart; represents extreme historical support. |
Resistance Price Levels
| Level | Range | Strength | Notes |
|---|---|---|---|
| $44.50 | $44.00 - $45.00 | Moderate | Dynamic resistance provided by the downward-sloping 50-day SMA and recent lower highs. |
| $47.50 | $47.00 - $48.00 | Strong | The upper boundary of the current multi-month consolidation range established after the major gap down. |
Potential Chart Patterns in Formation
| Strength | Pattern | Signal | Target | Details |
|---|---|---|---|---|
| Strong | Bearish Consolidation Range | Bearish | N/A | Since the large gap down, price action has been contained within a broad sideways-to-lower trading block. It is currently failing to break out the top side and drifting towards the lower boundaries, indicating continuation weakness. |
Frequently Asked Questions about NKE
What is the current sentiment for NKE?
The short-term sentiment for NKE is currently Bearish because Price recently failed at the 50-day SMA resistance and is now trending lower, breaking below the 20-day SMA. Momentum indicators are weak, with RSI falling back into the low 40s and MACD showing a bearish crossover with a negative histogram.. The long-term trend is classified as Bearish.
What are the key support levels for NKE?
StockDips.AI has identified key support levels for NKE at $40.50 and $39.25. These levels may represent potential accumulation zones where buying interest could emerge.
Is NKE in a significant dip or a Value Dip right now?
NKE has a Value Score of 70/100. It is not currently flagged as a significant dip in the Top Dips list. It is not listed as a Value Dip because the long-term sentiment or value-score threshold does not qualify.
View the full interactive analysis on StockDips.AI.