NVO Weekly Technical Analysis
Novo Nordisk A/S
Danish pharma specializing in diabetes and weight-loss drugs such as Ozempic and Wegovy.
NVO Technical Analysis Summary
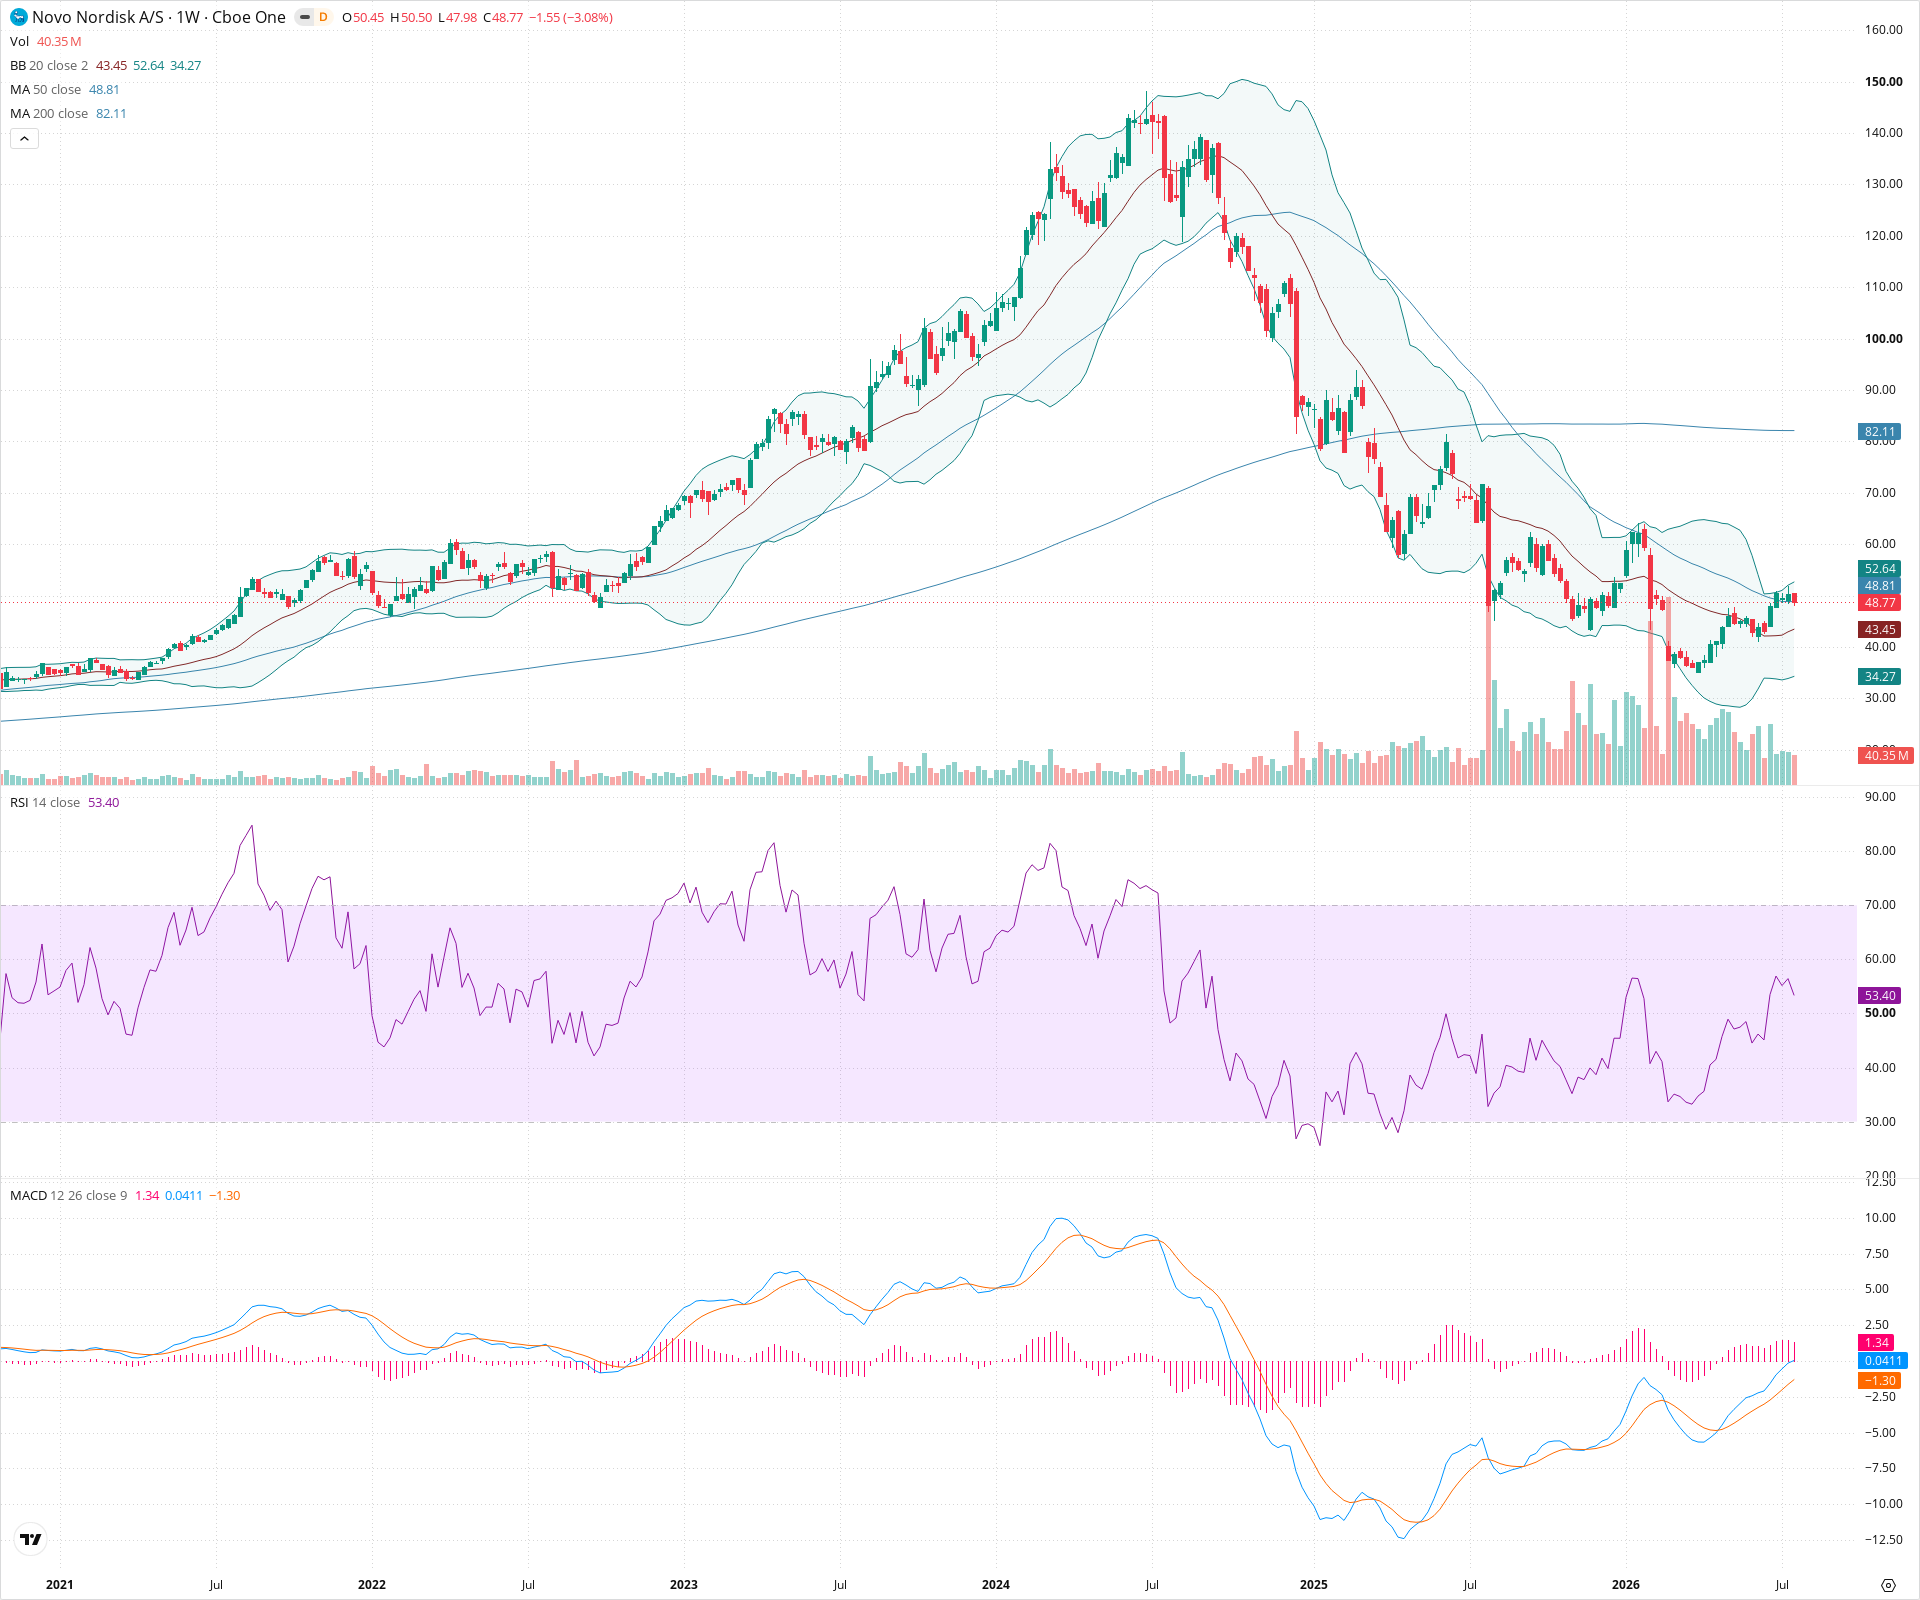
NVO on the weekly timeframe exhibits a mixed but potentially stabilizing technical picture. After a severe protracted decline from its all-time highs, price has found significant support in the 30-35 range and is attempting a reversal. Short-term sentiment is improving as price holds above recent lows and the MACD histogram shows signs of momentum shifting positive. Long-term, the asset must clear substantial overhead resistance, starting with the 20-week SMA, to confirm a new sustained uptrend, though the very long-term 200-week MA remains positively sloped.
Included In Lists
Related Tickers of Interest
NVO Weekly Chart
Sentiment
Short-term Sentiment (days to weeks): Bullish
Price is rebounding from recent lows, finding support near the 50-week MA, and moving back towards the middle Bollinger Band. MACD histogram is printing higher lows, indicating improving short-term momentum.
Long-term Sentiment (weeks to months): Bullish
The broader trend over the last several years is strongly up, despite the significant pullback in 2024. The 200-week SMA remains upward sloping, and price is currently attempting to hold support above the 50-week MA.
Report Metadata
- Timeframe: weekly
- Generated at: 2026-07-25T09:05:14.799Z
- Model: gemini-3.1-pro-preview
Support Price Levels
| Level | Range | Strength | Notes |
|---|---|---|---|
| $43.00 | $42.00 - $44.00 | Weak | Near-term support area marked by recent minor swing lows and the lower Bollinger band. |
| $32.50 | $30.00 - $35.00 | Strong | Major recent swing low area, reinforced by the lower Bollinger Band and historical price action from early 2023. |
Resistance Price Levels
| Level | Range | Strength | Notes |
|---|---|---|---|
| $53.50 | $52.00 - $55.00 | Strong | Significant resistance zone marked by the 20-week SMA and recent swing highs before the drop. |
| $82.50 | $80.00 - $85.00 | Strong | Major resistance level where the long-term uptrend was broken; significant historical consolidation area. |
Potential Chart Patterns in Formation
| Strength | Pattern | Signal | Target | Details |
|---|---|---|---|---|
| Weak | Potential Double Bottom / Accumulation | Bullish | N/A | Price recently established a significant low in the 30-35 range and is now attempting to bounce off a secondary higher low around 40-42, potentially forming a base after a long downtrend. |
Frequently Asked Questions about NVO
What is the current sentiment for NVO?
The short-term sentiment for NVO is currently Bullish because Price is rebounding from recent lows, finding support near the 50-week MA, and moving back towards the middle Bollinger Band. MACD histogram is printing higher lows, indicating improving short-term momentum.. The long-term trend is classified as Bullish.
What are the key support levels for NVO?
StockDips.AI has identified key support levels for NVO at $43.00 and $32.50. These levels may represent potential accumulation zones where buying interest could emerge.
Is NVO in a significant dip or a Value Dip right now?
NVO has a Value Score of 51/100. It is not currently flagged as a significant dip in the Top Dips list. It is not listed as a Value Dip because the long-term sentiment or value-score threshold does not qualify.
View the full interactive analysis on StockDips.AI.