QURE Daily Technical Analysis
uniQure N.V.
Biotechnology company that focuses on developing innovative gene therapies for patients with rare and devastating diseases.
QURE Technical Analysis Summary
QURE demonstrates a constructive long-term technical posture, highlighted by a recent Golden Cross and price maintaining levels significantly above its 200-day SMA. While the overarching trend is bullish, the stock is currently working through a short-term corrective phase, taking the form of a potential bull flag pattern. A decisive breakout above this flag's upper boundary, ideally supported by turning MACD momentum, would signal a likely continuation of the broader uptrend toward recent highs.
Included In Lists
Related Tickers of Interest
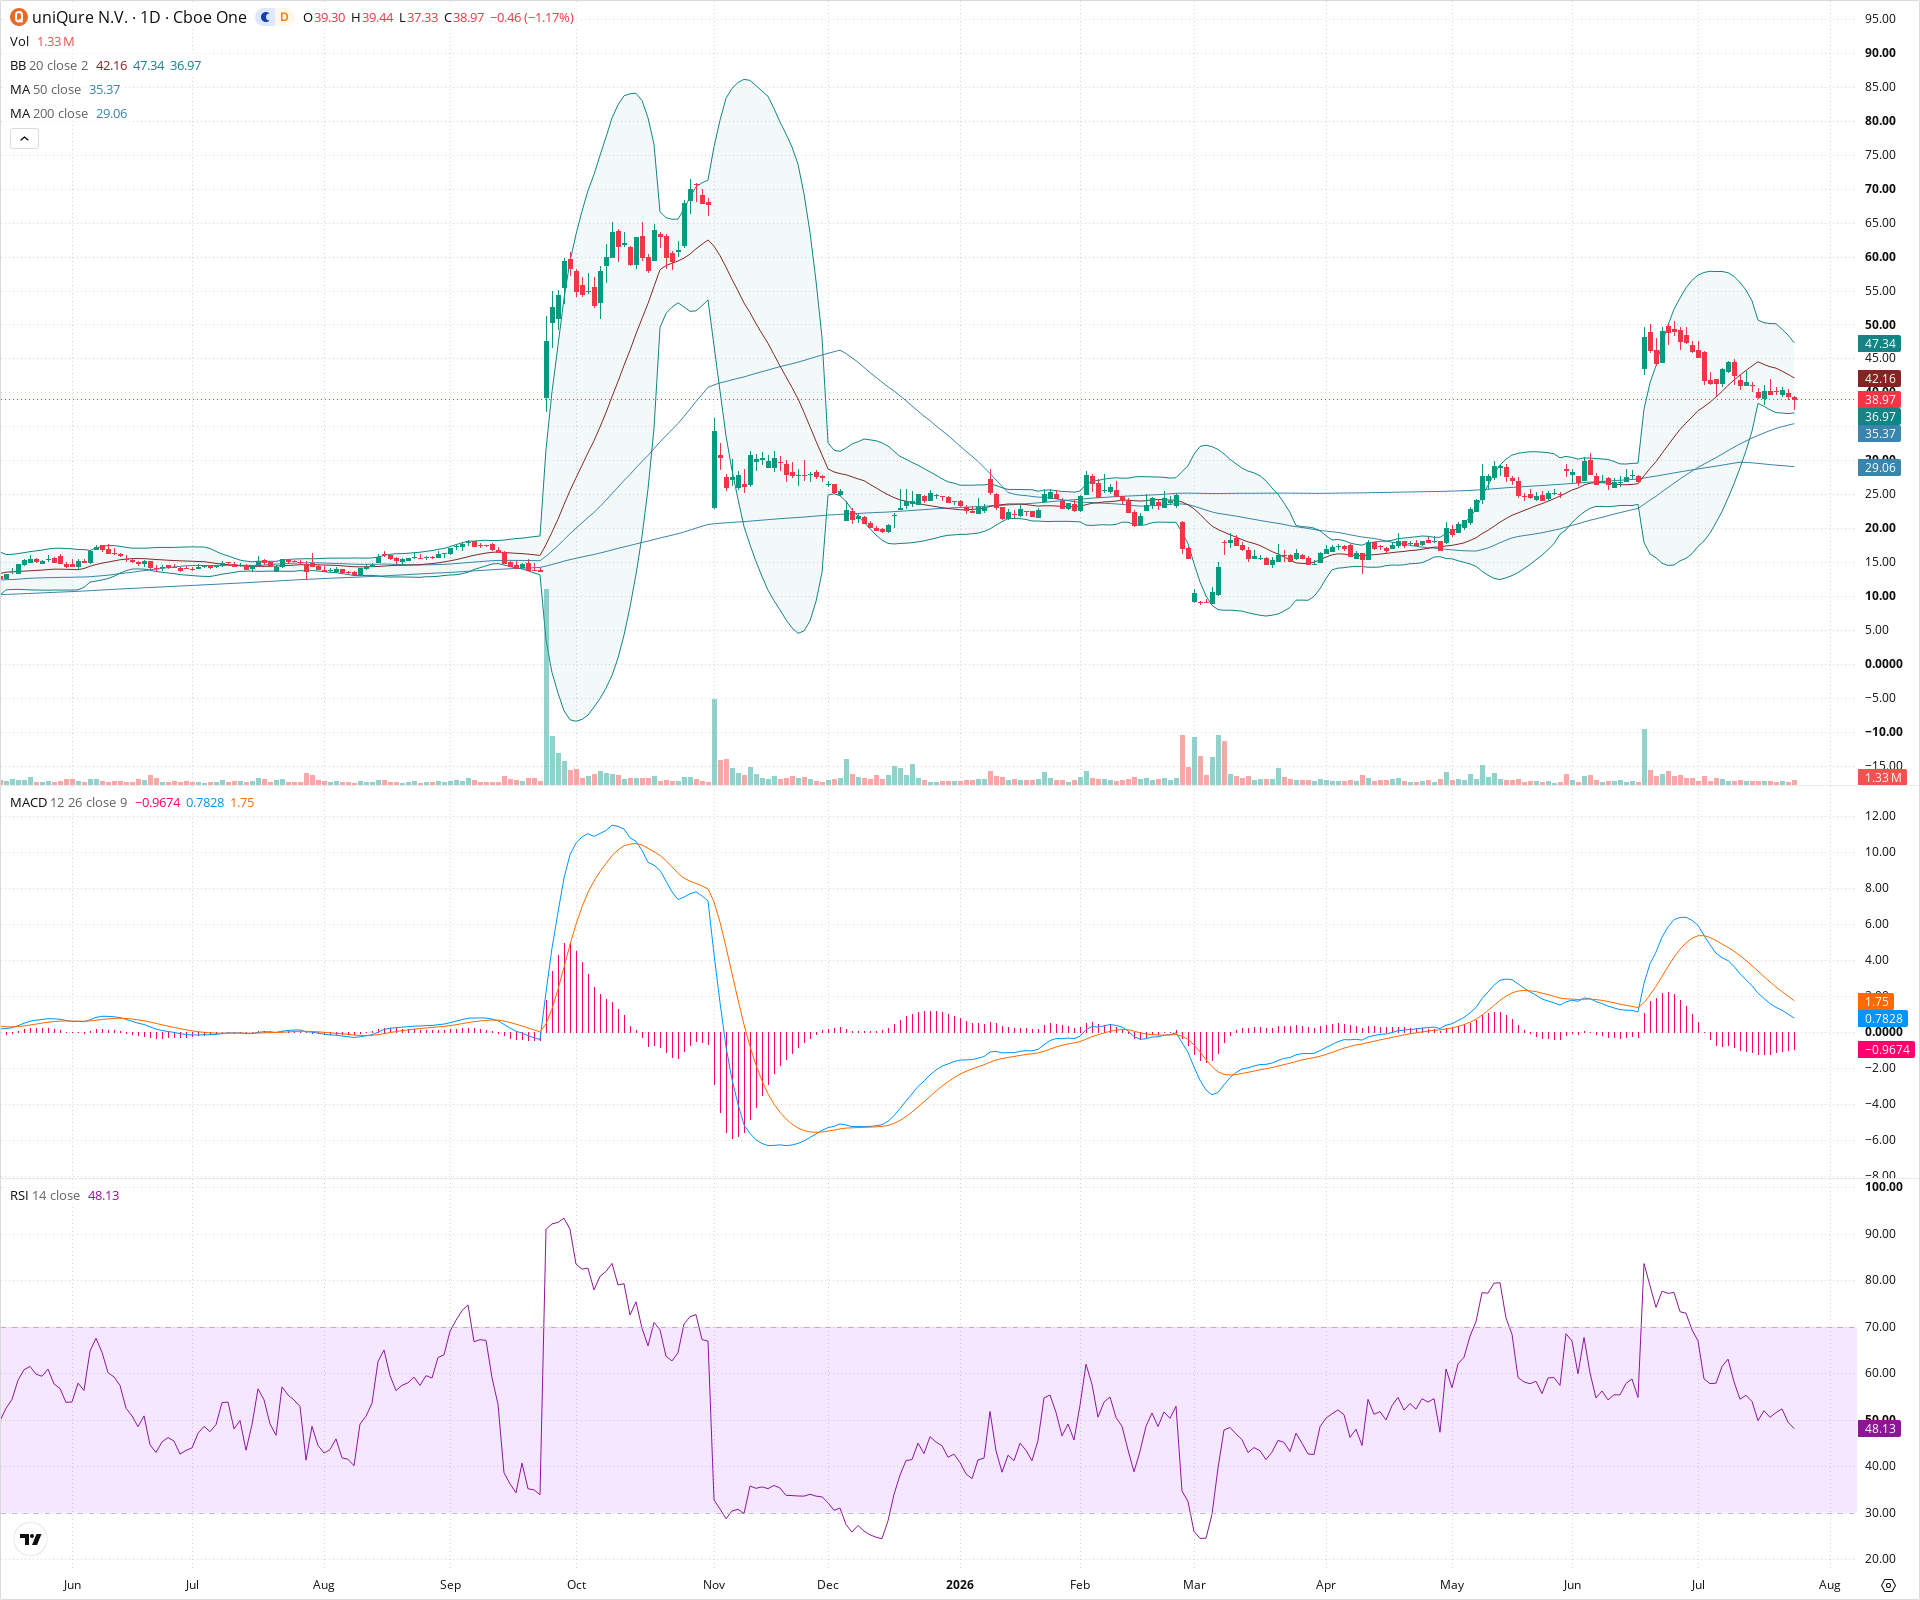
QURE Daily Chart
Sentiment
Short-term Sentiment (days to weeks): Bearish
Price is undergoing a multi-week pullback from recent highs near 50, characterized by lower highs and lower lows. This short-term downward momentum is confirmed by a bearish MACD crossover, an expanding negative MACD histogram, and the RSI dropping below the neutral 50 level.
Long-term Sentiment (weeks to months): Bullish
The broader trend is positive, with price trading well above a rising 200-day SMA. Additionally, a bullish 'Golden Cross' pattern is visible as the 50-day SMA has crossed above the 200-day SMA, suggesting underlying long-term strength despite the current pullback.
Report Metadata
- Timeframe: daily
- Generated at: 2026-07-24T21:06:08.898Z
- Model: gemini-3.1-pro-preview
Support Price Levels
| Level | Range | Strength | Notes |
|---|---|---|---|
| $36.00 | $35.00 - $37.00 | Strong | Confluence zone of the rising 50-day SMA and previous resistance-turned-support established in early June. |
| $29.00 | $28.00 - $30.00 | Strong | Aligns with the 200-day SMA and a significant consolidation base formed prior to the major June/July breakout. |
| $21.00 | $20.00 - $22.00 | Moderate | Major structural support zone established during the April/May consolidation period. |
Resistance Price Levels
| Level | Range | Strength | Notes |
|---|---|---|---|
| $49.50 | $48.00 - $51.00 | Strong | Recent swing high zone where the current sharp pullback originated. |
| $62.50 | $60.00 - $65.00 | Moderate | Historical structural resistance level from the initial stages of the massive gap down/selloff seen earlier on the chart. |
| $72.50 | $70.00 - $75.00 | Strong | The highest visible peak on the chart, representing major historical resistance. |
Potential Chart Patterns in Formation
| Strength | Pattern | Signal | Target | Details |
|---|---|---|---|---|
| Moderate | Bull Flag | Bullish | $50.00 | Following a massive impulsive move upward from ~20 to ~50, the price is currently consolidating in a downward-sloping channel. This orderly pullback resembles a bull flag continuation pattern. |
| Strong | Golden Cross | Bullish | N/A | The 50-day simple moving average has visibly crossed above the 200-day simple moving average, indicating a shift toward a long-term bullish trend. |
Frequently Asked Questions about QURE
What is the current sentiment for QURE?
The short-term sentiment for QURE is currently Bearish because Price is undergoing a multi-week pullback from recent highs near 50, characterized by lower highs and lower lows. This short-term downward momentum is confirmed by a bearish MACD crossover, an expanding negative MACD histogram, and the RSI dropping below the neutral 50 level.. The long-term trend is classified as Bullish.
What are the key support levels for QURE?
StockDips.AI has identified key support levels for QURE at $36.00 and $29.00. These levels may represent potential accumulation zones where buying interest could emerge.
Is QURE in a significant dip or a Value Dip right now?
QURE has a Value Score of 78/100. It is currently flagged as a significant dip in the Top Dips list. It is also listed as a Value Dip because long-term sentiment is bullish.
View the full interactive analysis on StockDips.AI.