QURE Weekly Technical Analysis
uniQure N.V.
Biotechnology company that focuses on developing innovative gene therapies for patients with rare and devastating diseases.
QURE Technical Analysis Summary
QURE experienced a dramatic structural shift characterized by an explosive, high-volume breakout that ended a prolonged multi-year downtrend. The stock is presently navigating a highly volatile consolidation phase, pulling back from recent highs to digest massive gains. While the long-term posture has turned bullish with price establishing a base well above major moving averages, short-term momentum is cooling, suggesting further choppy price action may be necessary before a decisive directional move.
Included In Lists
Related Tickers of Interest
QURE Weekly Chart
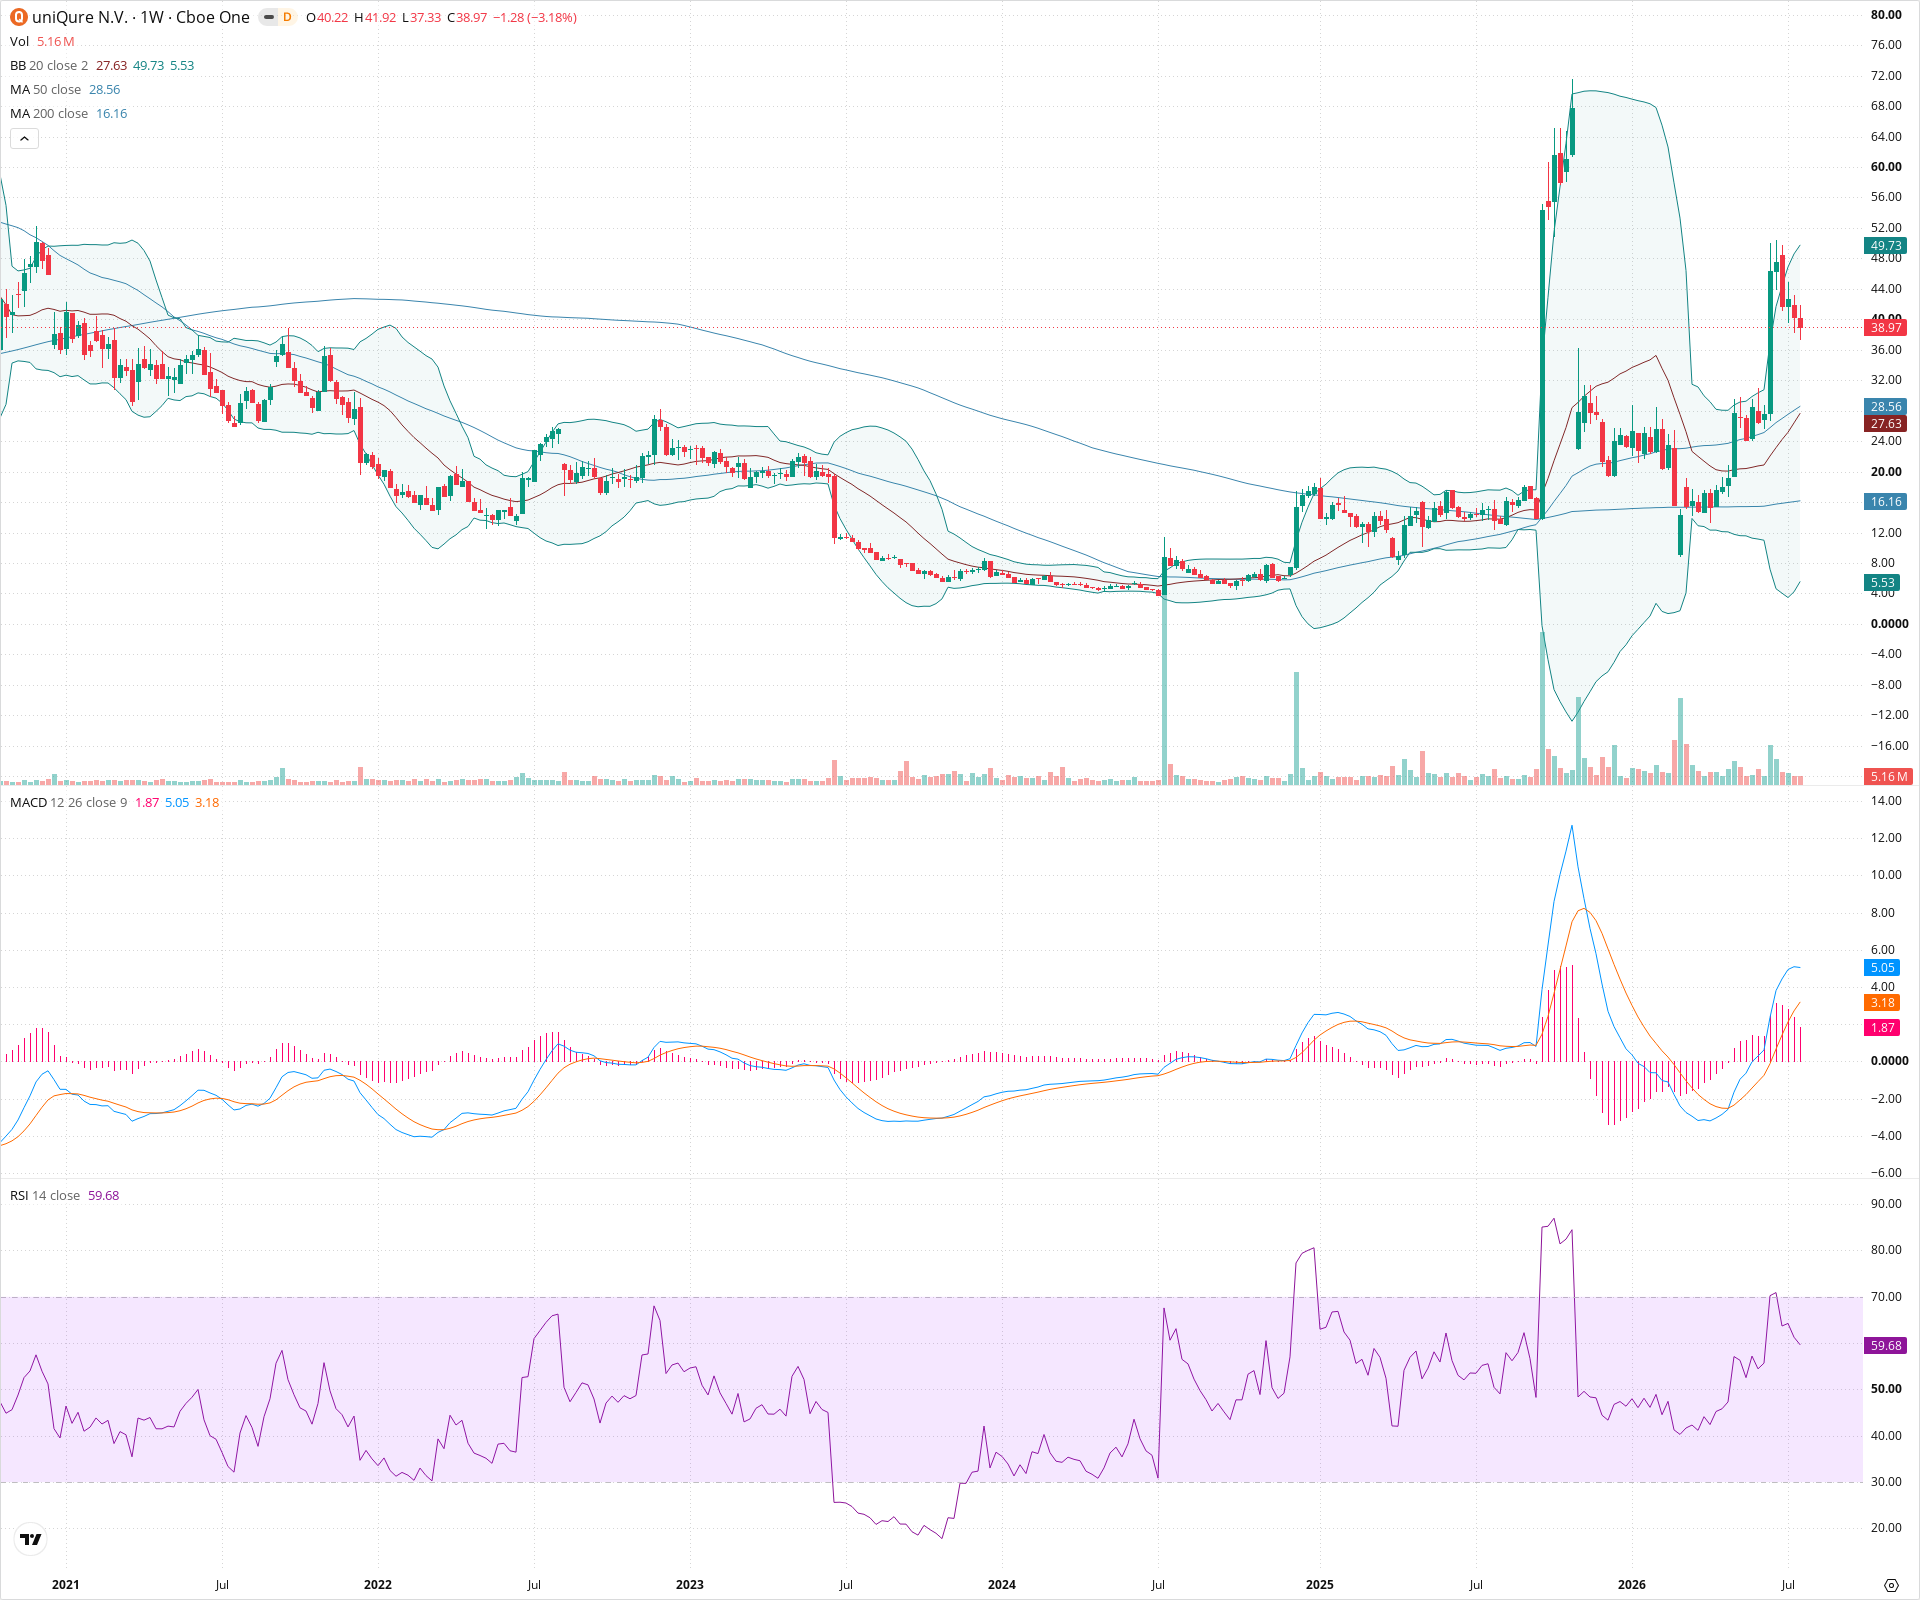
Sentiment
Short-term Sentiment (days to weeks): Neutral
Price is currently pulling back in a volatile manner after a recent lower high. The MACD histogram is decreasing, indicating waning upside momentum in the near term, though price remains supported above rising short-term moving averages.
Long-term Sentiment (weeks to months): Bullish
The long-term technical structure fundamentally changed with a massive, high-volume upward price shock that broke a multi-year downtrend. The 50-week SMA is curling sharply upwards, and price is maintaining levels well above the 200-week SMA.
Report Metadata
- Timeframe: weekly
- Generated at: 2026-07-25T09:11:38.199Z
- Model: gemini-3.1-pro-preview
Support Price Levels
| Level | Range | Strength | Notes |
|---|---|---|---|
| $28.00 | $27.00 - $29.00 | Weak | Immediate support zone aligning with the rising 20-week and 50-week Simple Moving Averages, as well as a recent consolidation low prior to the latest pullback. |
| $18.00 | $16.00 - $20.00 | Strong | Major structural support zone. This area represents the base from which the initial parabolic move launched, acted as support during the first major pullback, and aligns closely with the declining 200-week SMA. |
Resistance Price Levels
| Level | Range | Strength | Notes |
|---|---|---|---|
| $50.00 | $48.00 - $52.00 | Strong | Area of the most recent lower high on the weekly chart. Overcoming this zone is required to signal a continuation of the broader uptrend. |
| $70.00 | $68.00 - $72.00 | Strong | The absolute peak of the initial massive parabolic spike, representing significant overhead supply and structural resistance. |
Potential Chart Patterns in Formation
| Strength | Pattern | Signal | Target | Details |
|---|---|---|---|---|
| Strong | Post-Parabolic Consolidation | Neutral | N/A | Following an extreme, high-volume surge, the stock is currently engaged in a highly volatile, wide-ranging consolidation phase as it digests the historic move and allows moving averages to catch up. |
Frequently Asked Questions about QURE
What is the current sentiment for QURE?
The short-term sentiment for QURE is currently Neutral because Price is currently pulling back in a volatile manner after a recent lower high. The MACD histogram is decreasing, indicating waning upside momentum in the near term, though price remains supported above rising short-term moving averages.. The long-term trend is classified as Bullish.
What are the key support levels for QURE?
StockDips.AI has identified key support levels for QURE at $28.00 and $18.00. These levels may represent potential accumulation zones where buying interest could emerge.
Is QURE in a significant dip or a Value Dip right now?
QURE has a Value Score of 78/100. It is currently flagged as a significant dip in the Top Dips list. It is also listed as a Value Dip because long-term sentiment is bullish.
View the full interactive analysis on StockDips.AI.