RIOT Daily Technical Analysis
Riot Platforms
Riot Platforms is a vertically integrated digital infrastructure company that primarily specializes in Bitcoin mining and large-scale data center development.
RIOT Technical Analysis Summary
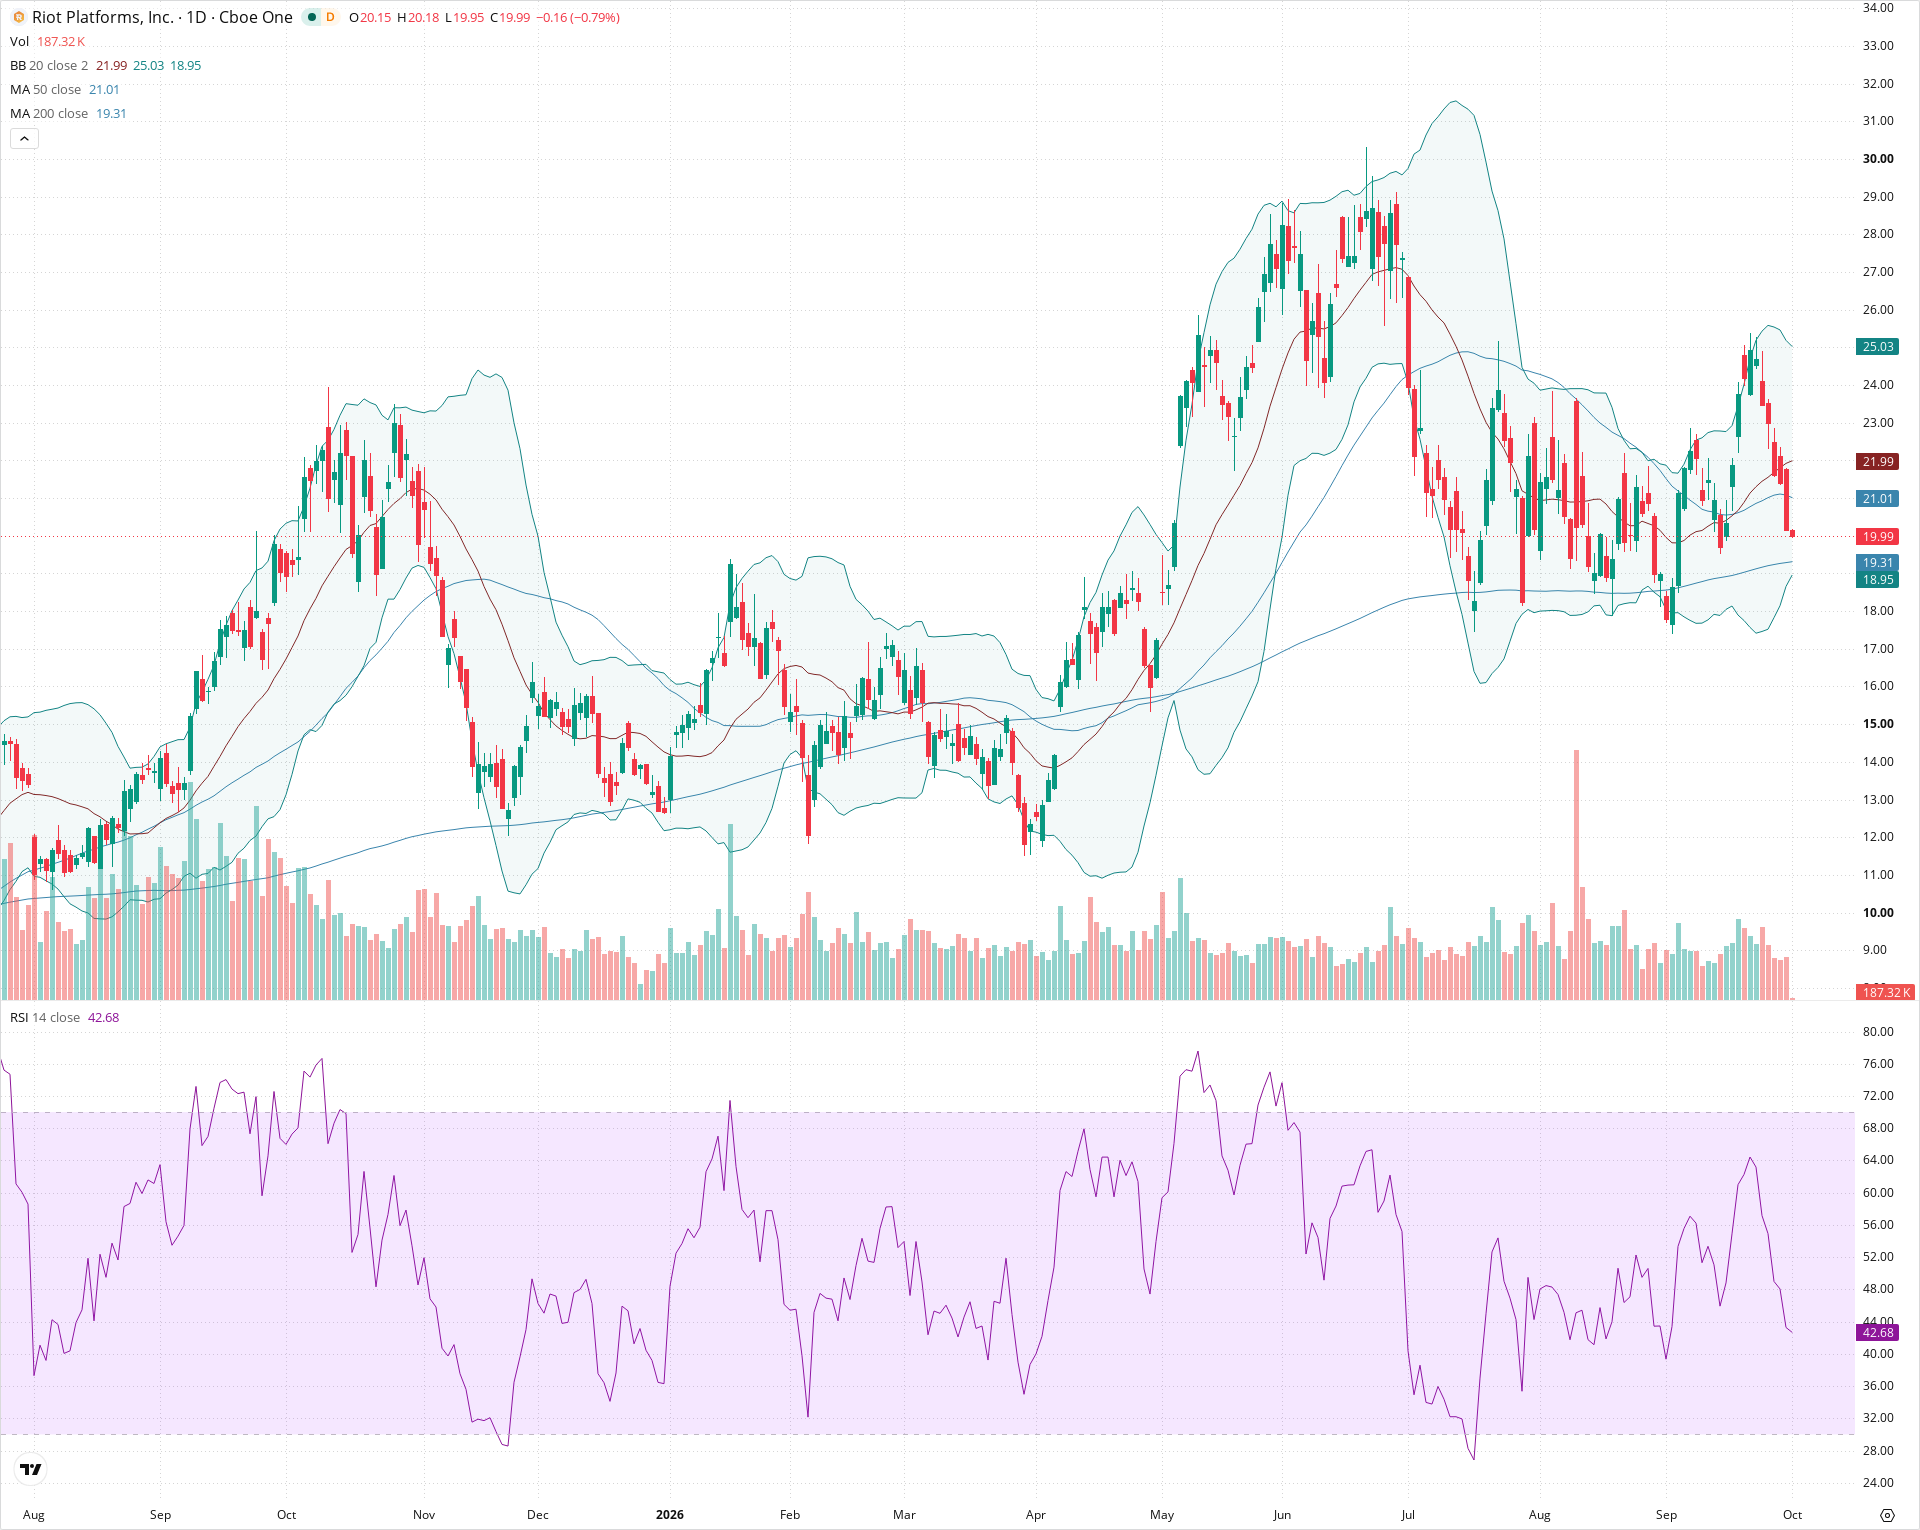
RIOT is pulling back within a multi-month consolidation range after being rejected near the 25.00 upper boundary. The short-term trend is pressured as the price trades below the 20-day and 50-day moving averages, heading directly toward key dynamic support at the 200-day SMA (19.31) and range base near 18.95. For long-term investors, maintaining a hold above the 200-day SMA is essential to keep the broader structural stability intact.
Included In Lists
Related Tickers of Interest
RIOT Daily Chart
Sentiment
Short-term Sentiment (days to weeks): Bearish
Price has fallen below both the 20-day SMA (21.99) and 50-day SMA (21.01) following a rejection near 25.00, accompanied by RSI declining below the 50 centerline to 42.68.
Long-term Sentiment (weeks to months): Neutral
Price remains above the upward-sloping 200-day SMA (19.31) within a broader multi-month horizontal consolidation zone established after the drop from the 30.00 high.
Report Metadata
- Timeframe: daily
- Generated at: 2026-10-01T13:51:08.556Z
- Model: gemini-3.8-flash
Support Price Levels
| Level | Range | Strength | Notes |
|---|---|---|---|
| $19.10 | $18.80 - $19.40 | Strong | Confluence of the rising 200-day SMA (19.31), lower Bollinger Band (18.95), and horizontal base lows from August and September. |
| $16.85 | $16.50 - $17.20 | Moderate | Structural trough and swing lows tested during the July and early August sell-offs. |
Resistance Price Levels
| Level | Range | Strength | Notes |
|---|---|---|---|
| $21.50 | $21.00 - $22.00 | Moderate | Overhead cluster formed by the 50-day SMA (21.01) and the 20-day SMA baseline (21.99). |
| $25.00 | $24.50 - $25.50 | Strong | Recent late September swing peak aligning with the upper Bollinger Band. |
Potential Chart Patterns in Formation
| Strength | Pattern | Signal | Target | Details |
|---|---|---|---|---|
| Moderate | Horizontal Trading Range | Neutral | N/A | Price has been oscillating between defined support near 18.50-19.00 and resistance near 25.00 since July, establishing a well-defined consolidation channel. |
Frequently Asked Questions about RIOT
What is the current sentiment for RIOT?
The short-term sentiment for RIOT is currently Bearish because Price has fallen below both the 20-day SMA (21.99) and 50-day SMA (21.01) following a rejection near 25.00, accompanied by RSI declining below the 50 centerline to 42.68.. The long-term trend is classified as Neutral.
What are the key support levels for RIOT?
StockDips.AI has identified key support levels for RIOT at $19.10 and $16.85. These levels may represent potential accumulation zones where buying interest could emerge.
Is RIOT in a significant dip or a Value Dip right now?
RIOT has a Value Score of 83/100. It is currently flagged as a significant dip in the Top Dips list. It is not listed as a Value Dip because the long-term sentiment or value-score threshold does not qualify.
View the full interactive analysis on StockDips.AI.