Soluna (SLNH) Daily Technical Analysis
Soluna Holdings, Inc
Soluna Holdings, Inc. develops and operates zero-carbon, green data centers powered by surplus renewable energy to support energy-intensive computing workloads, including AI, high-performance computing (HPC), and cryptocurrency mining.
SLNH Technical Analysis Summary
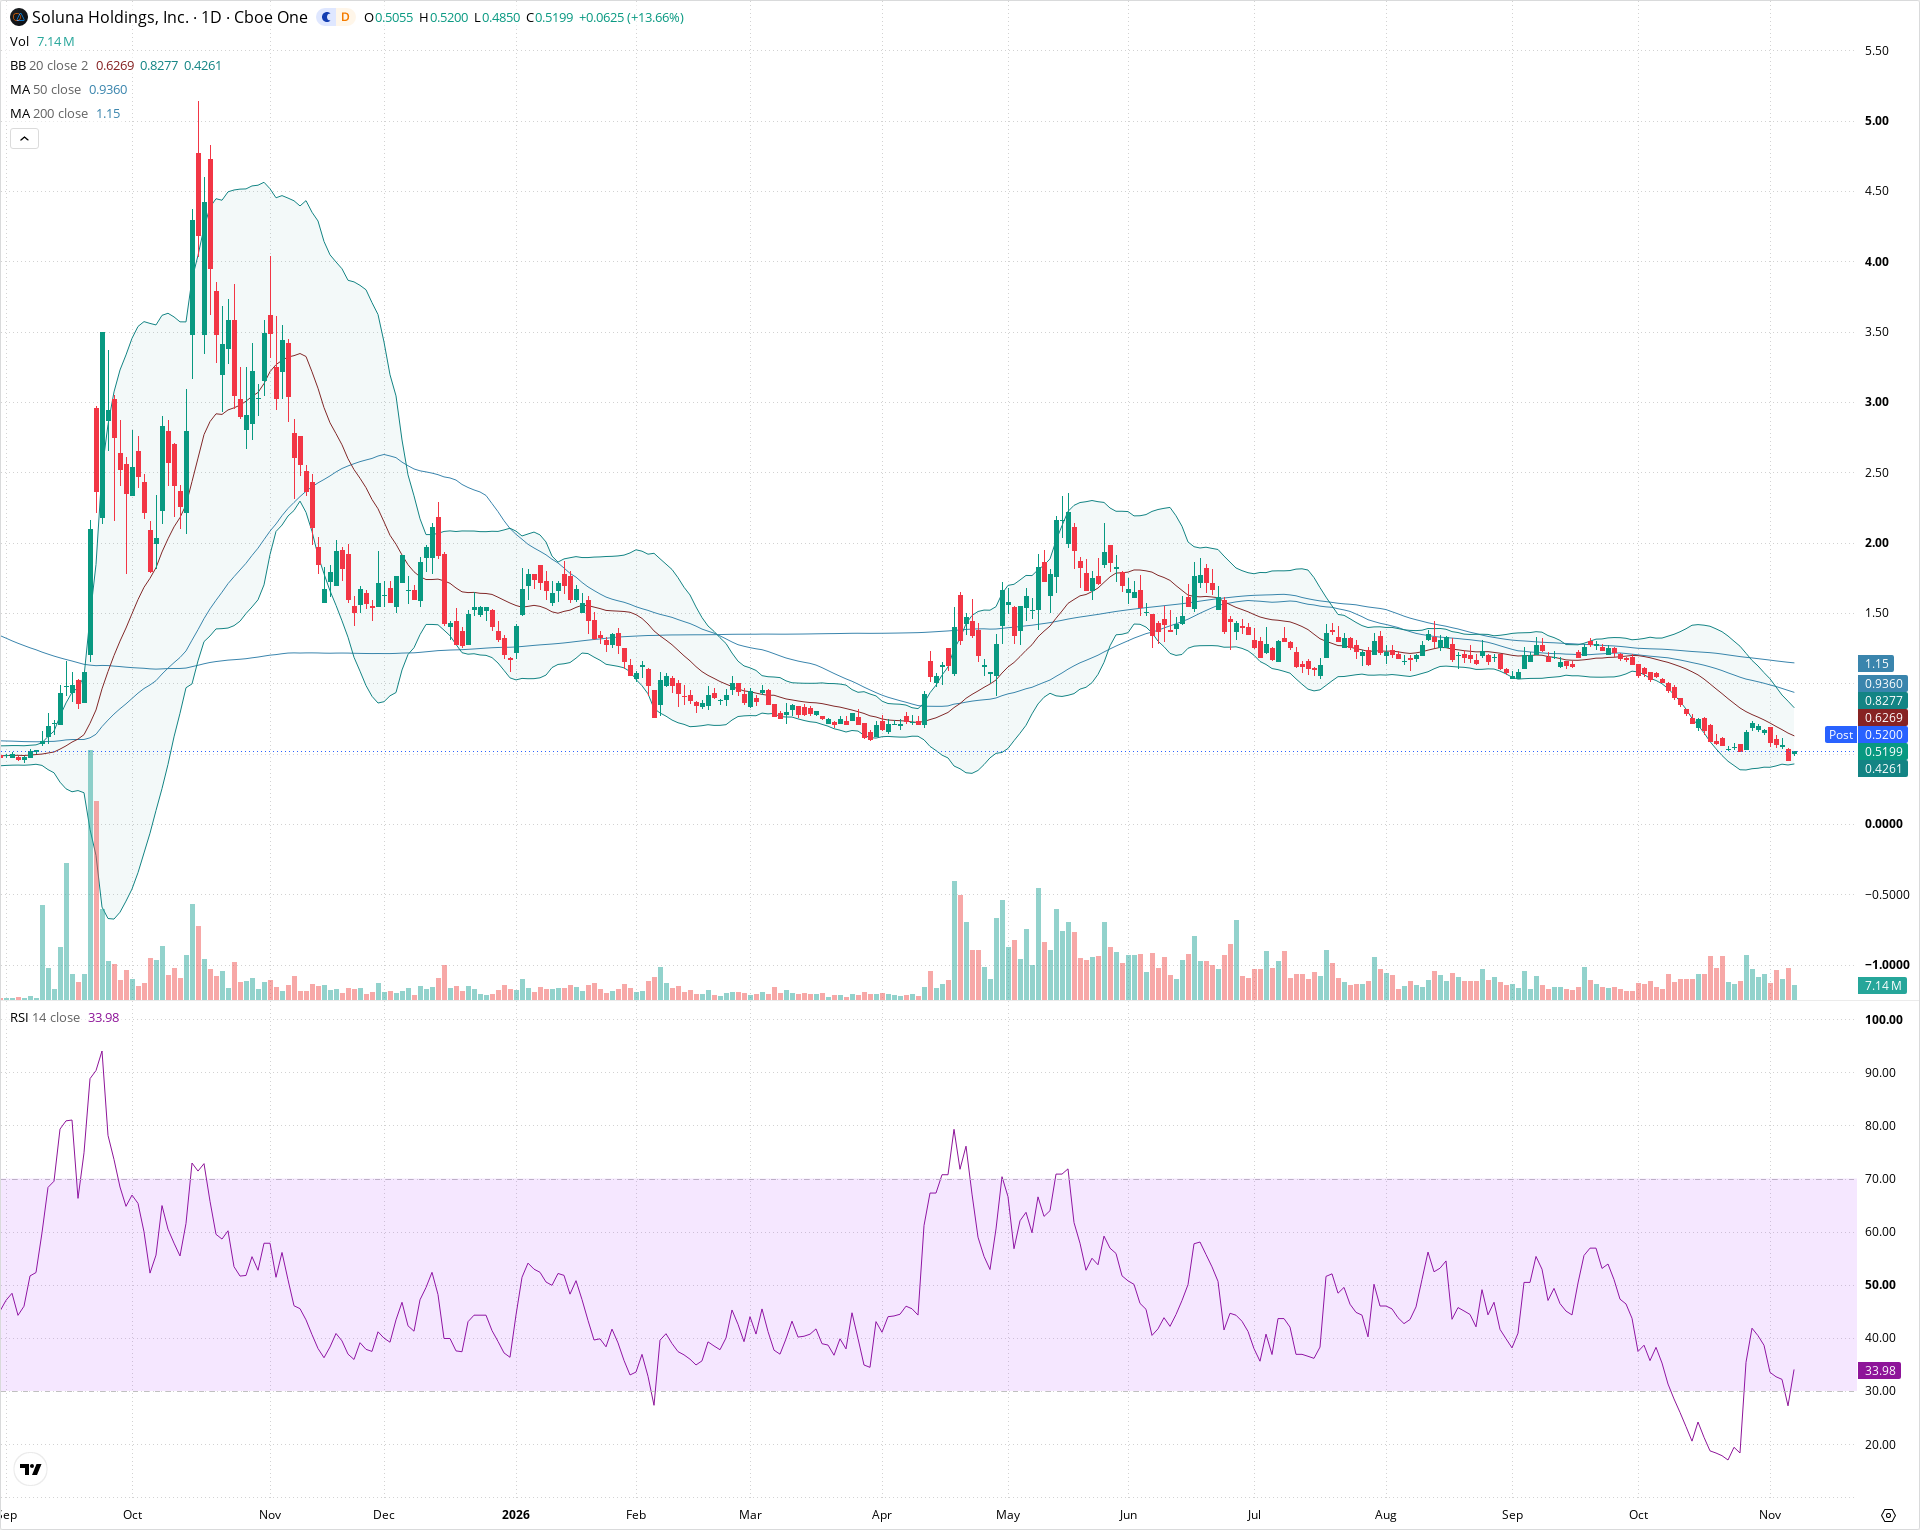
SLNH is locked in an entrenched long-term downtrend, trading well beneath both its 50-day and 200-day moving averages. While an oversold RSI bounce off the 0.43–0.45 support zone is underway, overhead supply remains heavy starting near the 20-day SMA at 0.63. Long-term trend continuation to the downside remains the dominant path unless price can reclaim key moving averages above 0.93.
Included In Lists
Related Tickers of Interest
SLNH Daily Chart
Sentiment
Short-term Sentiment (days to weeks): Bearish
Price remains suppressed below the falling 20-day SMA (0.6269) and trades near multi-month lows despite a recent bounce from oversold conditions.
Long-term Sentiment (weeks to months): Bearish
Clear long-term downtrend defined by price trading substantially below declining 50-day (0.9360) and 200-day (1.15) SMAs with a sustained series of lower highs.
Report Metadata
- Timeframe: daily
- Generated at: Nov 6, 2026
- Model: gemini-3.8-flash
Support Price Levels
| Level | Range | Strength | Notes |
|---|---|---|---|
| $0.44 | $0.43 - $0.45 | Moderate | Recent cycle low and proximity to the lower Bollinger Band boundary. |
Resistance Price Levels
| Level | Range | Strength | Notes |
|---|---|---|---|
| $0.63 | $0.60 - $0.65 | Moderate | Confluence of the 20-day SMA baseline and prior local breakdown level. |
| $0.83 | $0.80 - $0.85 | Strong | Upper Bollinger Band zone and prior multi-week horizontal consolidation shelf. |
| $1.04 | $0.93 - $1.15 | Strong | Major overhead moving average resistance spanning the 50-day and 200-day SMAs. |
Potential Chart Patterns in Formation
| Strength | Pattern | Signal | Target | Details |
|---|---|---|---|---|
| Moderate | Descending Channel | Bearish | N/A | Steep downward sloping trend channel established since the late September breakdown, characterized by consecutive lower highs and lower lows. |
Frequently Asked Questions about SLNH
What is the current sentiment for SLNH?
The short-term sentiment for SLNH is currently Bearish because Price remains suppressed below the falling 20-day SMA (0.6269) and trades near multi-month lows despite a recent bounce from oversold conditions. The long-term trend is classified as Bearish.
What are the key support levels for SLNH?
StockDips.AI has identified key support levels for SLNH at $0.44. These levels may represent potential accumulation zones where buying interest could emerge.
Is SLNH in a significant dip or a Value Dip right now?
SLNH has a Value Score of 57/100. It is not currently flagged as a significant dip in the Top Dips list. It is not listed as a Value Dip because the long-term sentiment or value-score threshold does not qualify.
View the full interactive analysis on StockDips.AI.