SKHY Daily Technical Analysis
SK hynix Inc
South Korean semiconductor company and the world's second-largest memory chip manufacturer. Headquartered in Icheon, South Korea, it specializes in dynamic random-access memory (DRAM) chips, NAND flash memory, and high-bandwidth memory (HBM) essential for artificial intelligence hardware
SKHY Technical Analysis Summary
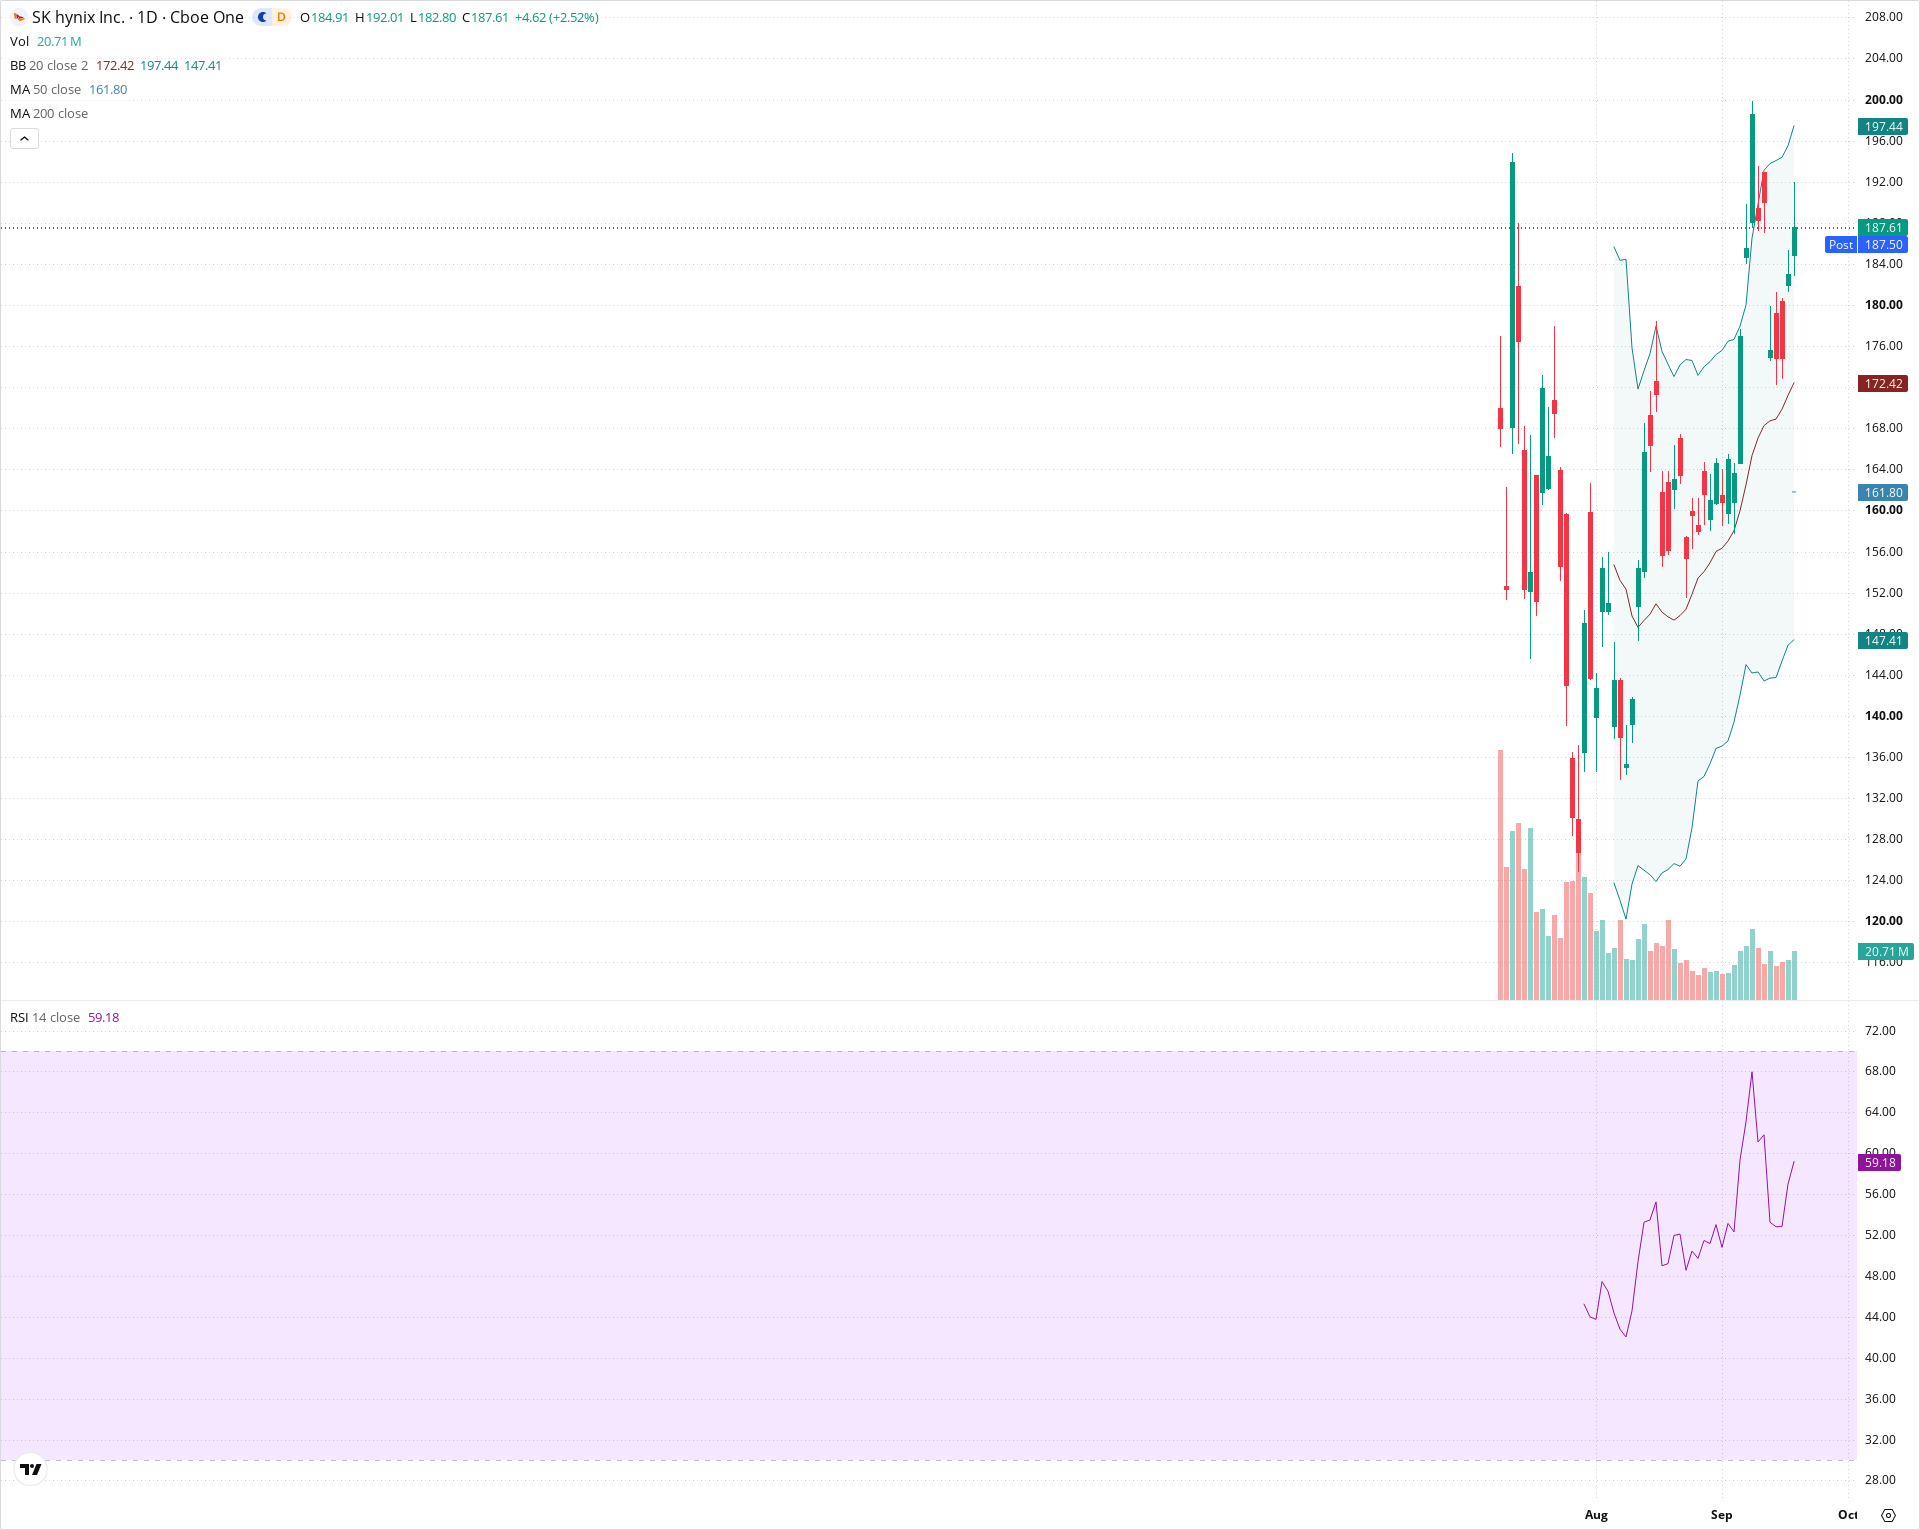
SK hynix continues its recovery off the August lows, with price action maintaining a bullish trajectory above both the 20-day (172.42) and 50-day (161.80) moving averages. The recent successful defense of the 20-day midline indicates persistent buying pressure aimed at retesting the key resistance band at 196.00–200.00. As long as the stock remains above the 172.00 support level, the broader medium-to-long term structure remains favorable for further upside.
Included In Lists
Related Tickers of Interest
SKHY Daily Chart
Sentiment
Short-term Sentiment (days to weeks): Bullish
Price rebounded cleanly off the 20-day Bollinger midline (172.42) with expanding bullish candles, supported by RSI turning upward at 59.18.
Long-term Sentiment (weeks to months): Bullish
The market staged an aggressive recovery from the August lows around 134.00, trading firmly above the upward-sloping 50-day moving average at 161.80.
Report Metadata
- Timeframe: daily
- Generated at: 2026-09-18T20:16:09.200Z
- Model: gemini-3.8-flash
Support Price Levels
| Level | Range | Strength | Notes |
|---|---|---|---|
| $174.00 | $172.00 - $176.00 | Strong | Confluence of recent swing low support and the 20-day SMA/Bollinger midline (172.42). |
| $160.00 | $158.00 - $162.00 | Moderate | Corresponds to the 50-day moving average (161.80) and prior consolidation base. |
| $137.00 | $134.00 - $140.00 | Strong | Major August capitulation swing low forming the base of the current advance. |
Resistance Price Levels
| Level | Range | Strength | Notes |
|---|---|---|---|
| $198.00 | $196.00 - $200.00 | Strong | Recent swing high wick and the upper Bollinger Band near 197.44, representing psychological resistance. |
| $206.00 | $204.00 - $208.00 | Weak | Overhead extension target upon a confirmed breakout above the 200.00 level. |
Potential Chart Patterns in Formation
| Strength | Pattern | Signal | Target | Details |
|---|---|---|---|---|
| Moderate | Higher Low / Trend Continuation | Bullish | $200.00 | Price formed a higher swing low near 174.00 relative to the 134.00 bottom, resuming upward momentum toward the 198.00–200.00 resistance. |
Frequently Asked Questions about SKHY
What is the current sentiment for SKHY?
The short-term sentiment for SKHY is currently Bullish because Price rebounded cleanly off the 20-day Bollinger midline (172.42) with expanding bullish candles, supported by RSI turning upward at 59.18.. The long-term trend is classified as Bullish.
What are the key support levels for SKHY?
StockDips.AI has identified key support levels for SKHY at $174.00 and $160.00. These levels may represent potential accumulation zones where buying interest could emerge.
Is SKHY in a significant dip or a Value Dip right now?
SKHY has a Value Score of 44/100. It is not currently flagged as a significant dip in the Top Dips list. It is not listed as a Value Dip because the long-term sentiment or value-score threshold does not qualify.
View the full interactive analysis on StockDips.AI.