STM Daily Technical Analysis
STMicroelectronics NV
STMicroelectronics N.V. is a global semiconductor leader designing, developing, manufacturing, and marketing a broad range of discrete devices, microcontrollers, power management chips, and custom integrated circuits for automotive, industrial, consumer, and communications applications.
STM Technical Analysis Summary
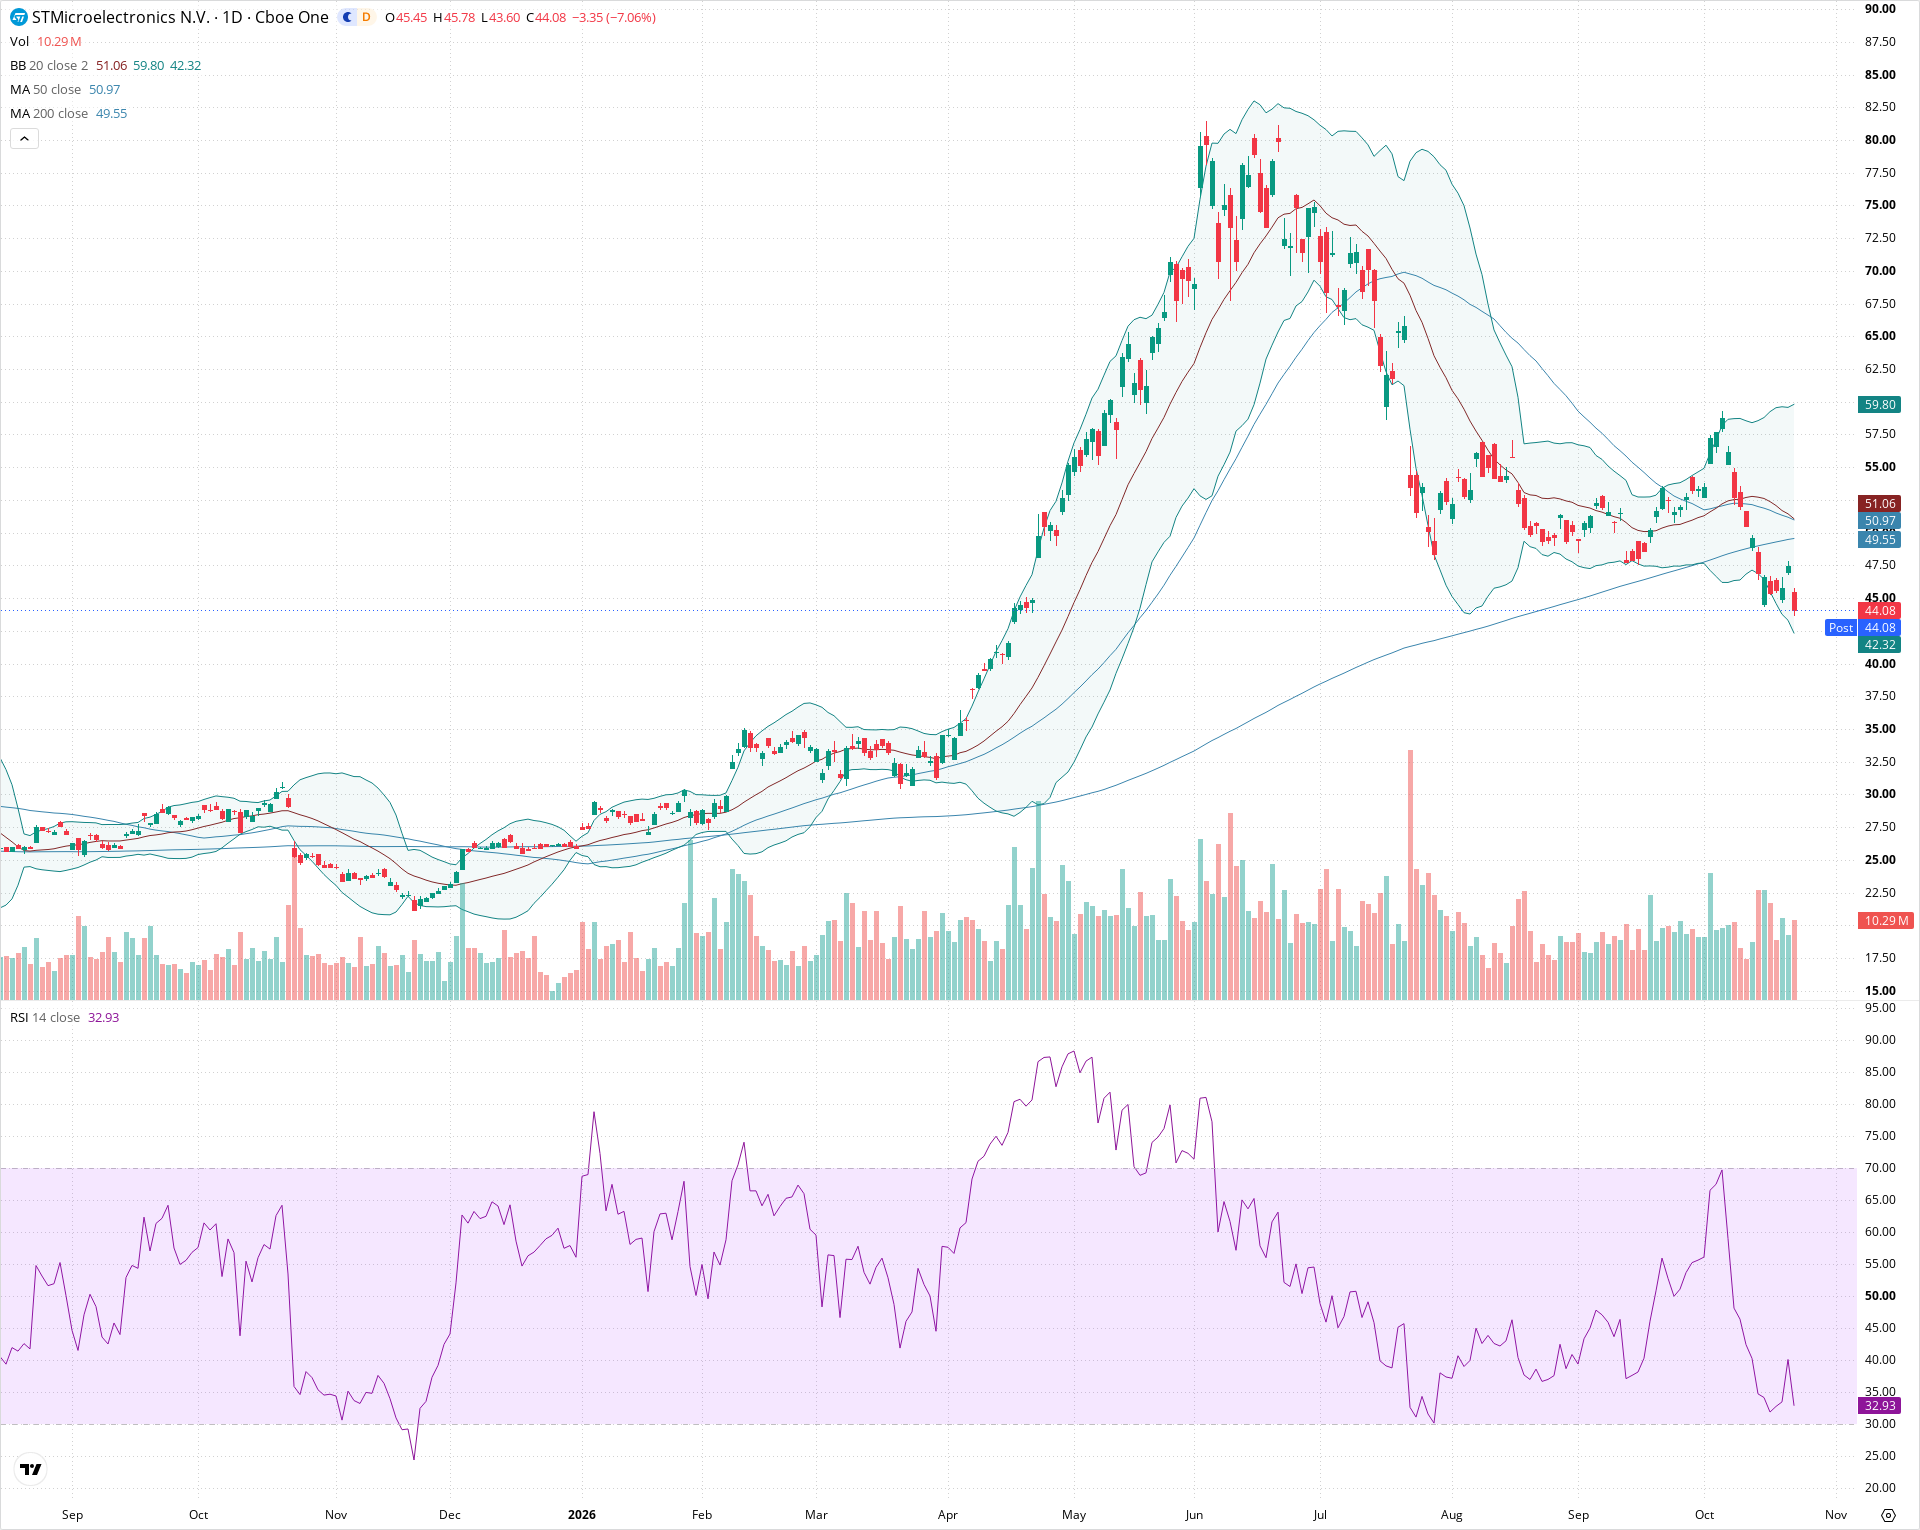
STM is under heavy selling pressure following a steep drop below the 200-day SMA and short-term moving average cluster. The broad structure shows a dominant downtrend from the mid-year high near 82.00, with recent relief rallies consistently forming lower highs. Unless price can reclaim the 49.50–51.50 resistance zone, the technical outlook favors continued downside toward major support around 35.00.
Included In Lists
Related Tickers of Interest
STM Daily Chart
Sentiment
Short-term Sentiment (days to weeks): Bearish
Price experienced a sharp breakdown below the 20-day, 50-day, and 200-day moving averages, with consecutive large red candles pushing toward the lower Bollinger Band and RSI falling sharply toward oversold territory (32.93).
Long-term Sentiment (weeks to months): Bearish
The stock has established a pronounced downtrend from its prior peak near 82.00, recently breaking below the 200-day SMA (49.55) after failing to sustain its recovery attempt above 55.00.
Report Metadata
- Timeframe: daily
- Generated at: 2026-10-22T20:17:58.924Z
- Model: gemini-3.8-flash
Support Price Levels
| Level | Range | Strength | Notes |
|---|---|---|---|
| $42.50 | $42.00 - $43.00 | Moderate | Coincides with the lower Bollinger Band (42.32) and immediate downside projection. |
| $35.00 | $34.00 - $36.00 | Strong | Significant multi-month consolidation and breakout base from February–April. |
Resistance Price Levels
| Level | Range | Strength | Notes |
|---|---|---|---|
| $50.50 | $49.50 - $51.50 | Strong | Confluence of the 200-day SMA (49.55), 50-day SMA (50.97), and 20-day SMA middle band (51.06). |
| $56.00 | $55.00 - $57.00 | Moderate | October swing high resistance that capped the prior counter-trend rally. |
Potential Chart Patterns in Formation
| Strength | Pattern | Signal | Target | Details |
|---|---|---|---|---|
| Strong | Moving Average Breakdown | Bearish | $36.00 | Price broke decisively below the critical moving average cluster (20-day, 50-day, and 200-day SMAs), signaling strong downward momentum and trend continuation. |
Frequently Asked Questions about STM
What is the current sentiment for STM?
The short-term sentiment for STM is currently Bearish because Price experienced a sharp breakdown below the 20-day, 50-day, and 200-day moving averages, with consecutive large red candles pushing toward the lower Bollinger Band and RSI falling sharply toward oversold territory (32.93).. The long-term trend is classified as Bearish.
What are the key support levels for STM?
StockDips.AI has identified key support levels for STM at $42.50 and $35.00. These levels may represent potential accumulation zones where buying interest could emerge.
Is STM in a significant dip or a Value Dip right now?
STM has a Value Score of 80/100. It is currently flagged as a significant dip in the Top Dips list. It is not listed as a Value Dip because the long-term sentiment or value-score threshold does not qualify.
View the full interactive analysis on StockDips.AI.