SLV Weekly Technical Analysis
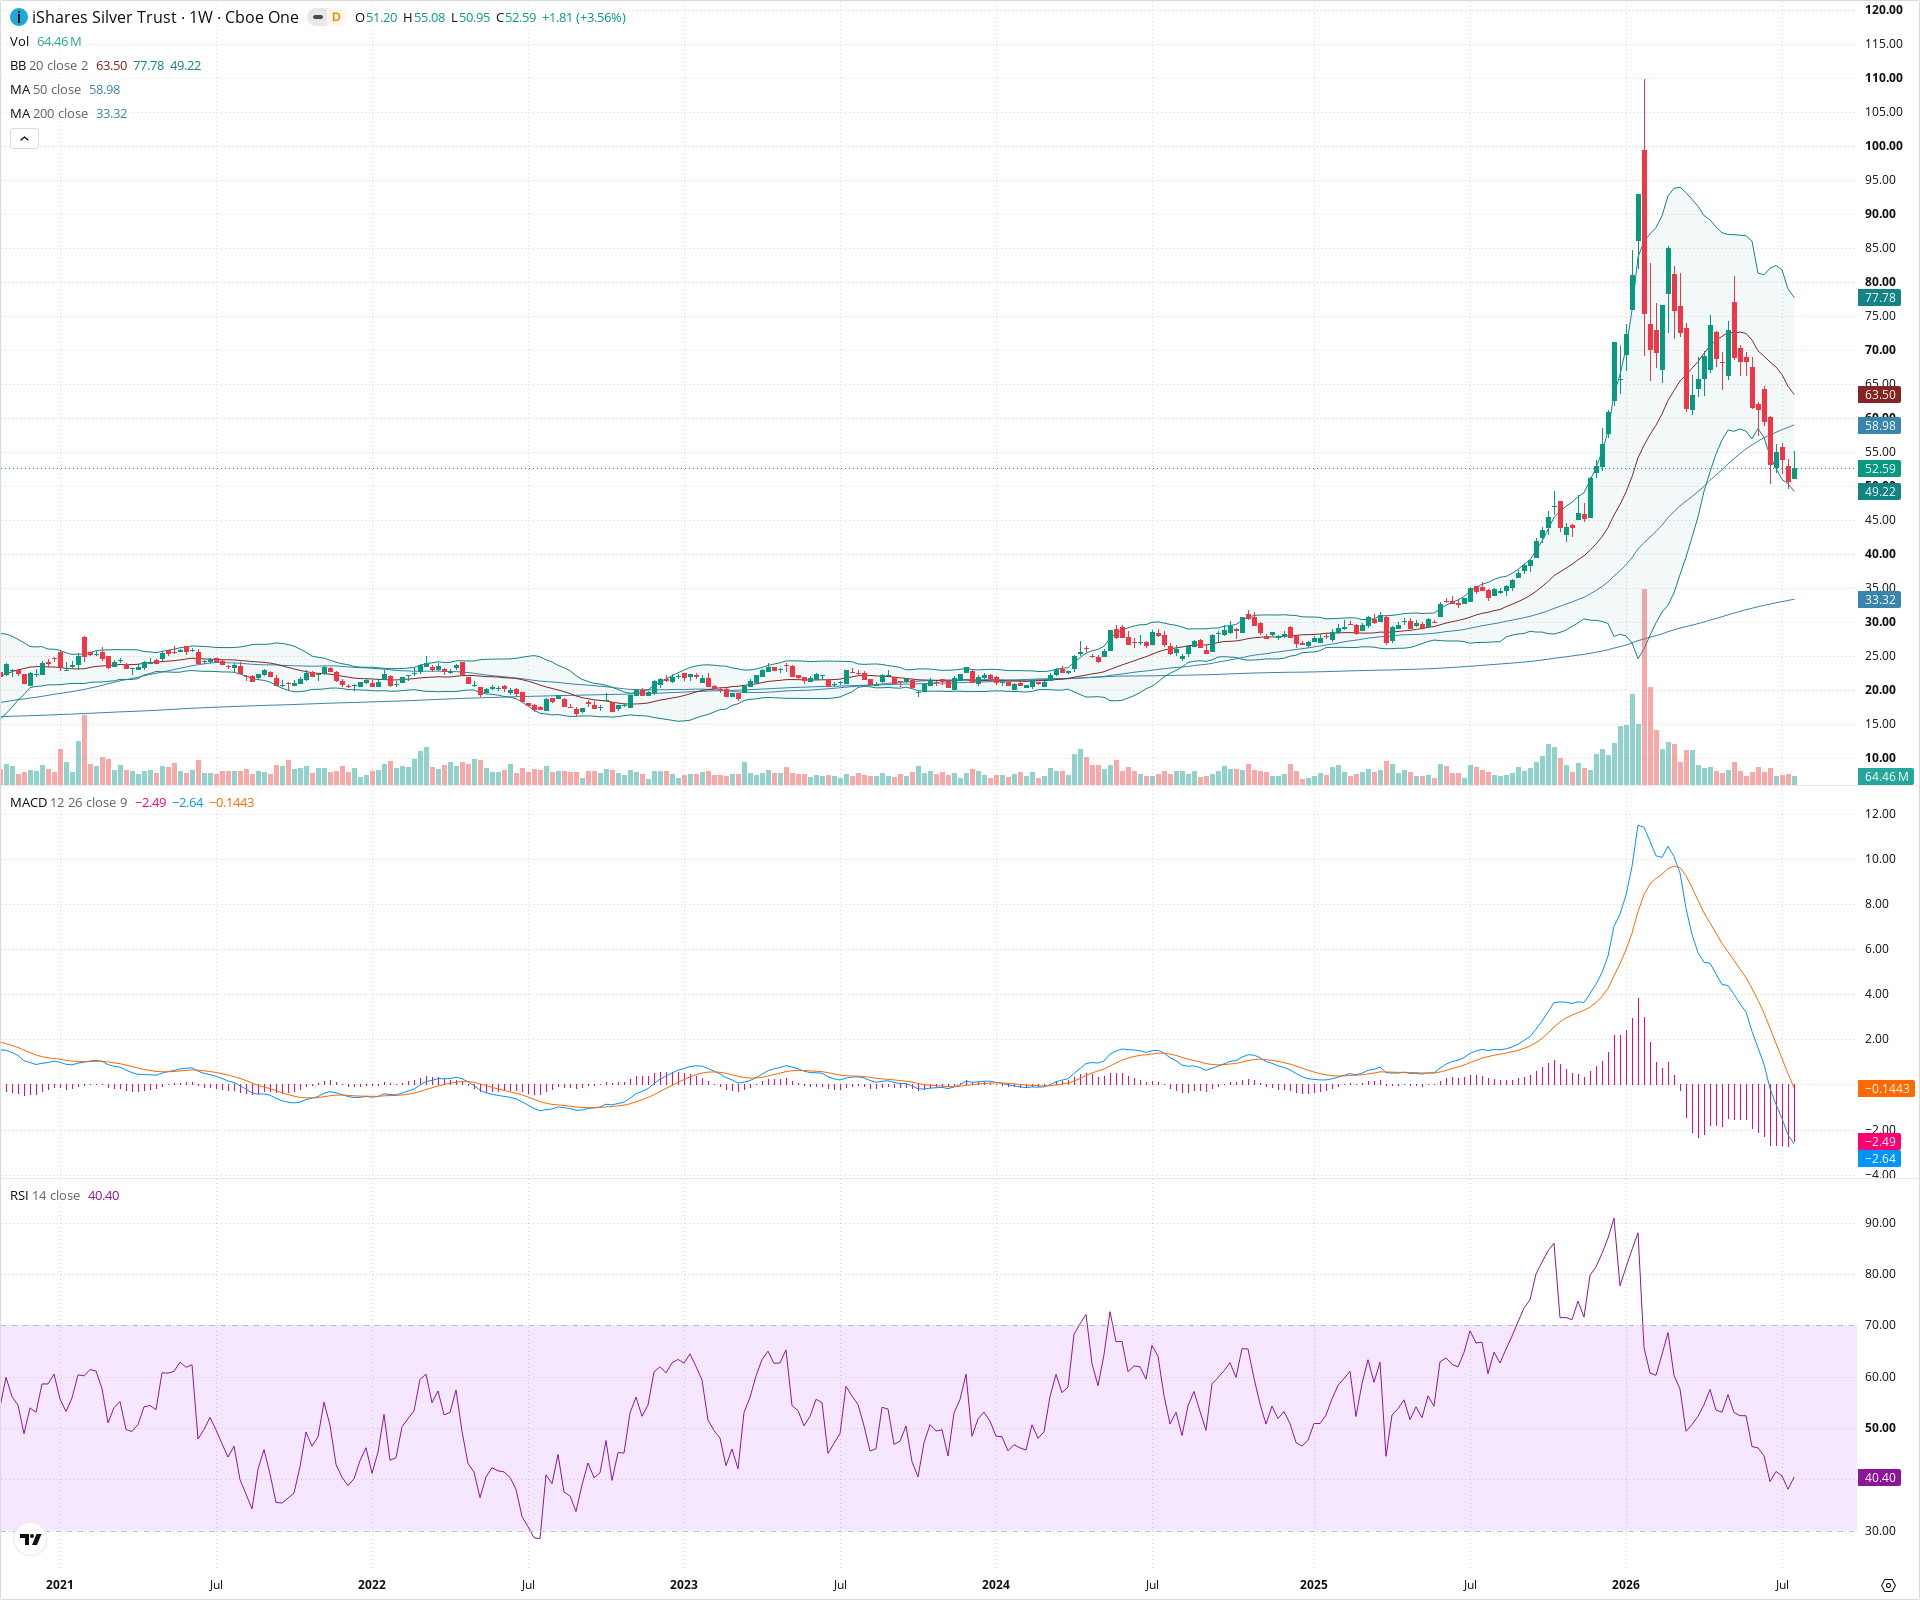
iShares Silver Trust
Tracks the price of physical silver bullion. Silver has both monetary and industrial uses, making it more volatile than gold. It is commonly viewed as a leveraged play on precious metals with sensitivity to economic growth, inflation, and speculative cycles.
SLV Technical Analysis Summary
SLV experienced a historic parabolic blow-off top, surging past 110 before violently crashing back down. Short-term momentum is severely bearish as it breaks below the 50-week SMA with plunging MACD and RSI. However, from a very long-term perspective, it is executing a massive mean reversion toward the 200-week SMA and previous multi-year base, which remains an overarching macro uptrend structure.
Included In Lists
Related Tickers of Interest
SLV Weekly Chart
Sentiment
Short-term Sentiment (days to weeks): Bearish
Price is in a steep multi-week downtrend, trading below the 20-week and 50-week SMAs. MACD is deeply negative and diverging lower, while RSI is trending down toward 40.
Long-term Sentiment (weeks to months): Bullish
Despite the severe recent correction, the longer-term structure remains a massive uptrend. Price is still well above the rising 200-week SMA, and the 50-week SMA remains above the 200-week SMA.
Report Metadata
- Timeframe: weekly
- Generated at: 2026-07-25T09:07:12.702Z
- Model: gemini-3.1-pro-preview
Support Price Levels
| Level | Range | Strength | Notes |
|---|---|---|---|
| $49.00 | $48.00 - $50.00 | Strong | Current consolidation zone acting as immediate support, coinciding with the lower Bollinger Band. |
| $34.00 | $33.00 - $35.00 | Strong | Confluence of the rising 200-week SMA and a massive multi-year breakout base from 2021-2024. |
Resistance Price Levels
| Level | Range | Strength | Notes |
|---|---|---|---|
| $59.00 | $58.00 - $60.00 | Strong | The 50-week SMA, which price recently broke below and which may now act as overhead resistance. |
| $78.50 | $77.00 - $80.00 | Weak | Previous swing high zone during the descent from the blow-off top. |
| $110.00 | $105.00 - $115.00 | Strong | The massive blow-off top peak. |
Potential Chart Patterns in Formation
| Strength | Pattern | Signal | Target | Details |
|---|---|---|---|---|
| Strong | Parabolic blow-off top and crash | Bearish | N/A | Price went parabolic, rocketing from ~30 to over 110 in a matter of months, followed by a violent crash back toward the moving averages. |
| Strong | Mean Reversion | Bearish | $33.32 | Price is aggressively reverting to the mean (50-week and 200-week SMAs) following an unsustainable parabolic advance. |
Frequently Asked Questions about SLV
What is the current sentiment for SLV?
The short-term sentiment for SLV is currently Bearish because Price is in a steep multi-week downtrend, trading below the 20-week and 50-week SMAs. MACD is deeply negative and diverging lower, while RSI is trending down toward 40.. The long-term trend is classified as Bullish.
What are the key support levels for SLV?
StockDips.AI has identified key support levels for SLV at $49.00 and $34.00. These levels may represent potential accumulation zones where buying interest could emerge.
Is SLV in a significant dip or a Value Dip right now?
SLV has a Value Score of 28/100. It is not currently flagged as a significant dip in the Top Dips list. It is not listed as a Value Dip because the long-term sentiment or value-score threshold does not qualify.
View the full interactive analysis on StockDips.AI.