SNDK Weekly Technical Analysis
SanDisk Corp
Designs and manufactures flash memory products and solutions, including solid-state drives (SSDs), memory cards, and USB flash drives. The company develops products for a wide range of applications, from consumer electronics to high-growth data centers and AI computing.
SNDK Technical Analysis Summary
SNDK has undergone a classic parabolic blow-off top, resulting in a violent and rapid short-term correction. Immediate momentum is firmly bearish, evidenced by plunging RSI and a negative MACD crossover on the weekly chart. However, for long-term investors, the secular uptrend remains unbroken as the stock is simply reverting toward its moving averages; the primary focus is now on whether it can find stable footing near the 20-week SMA support zone.
Included In Lists
Related Tickers of Interest
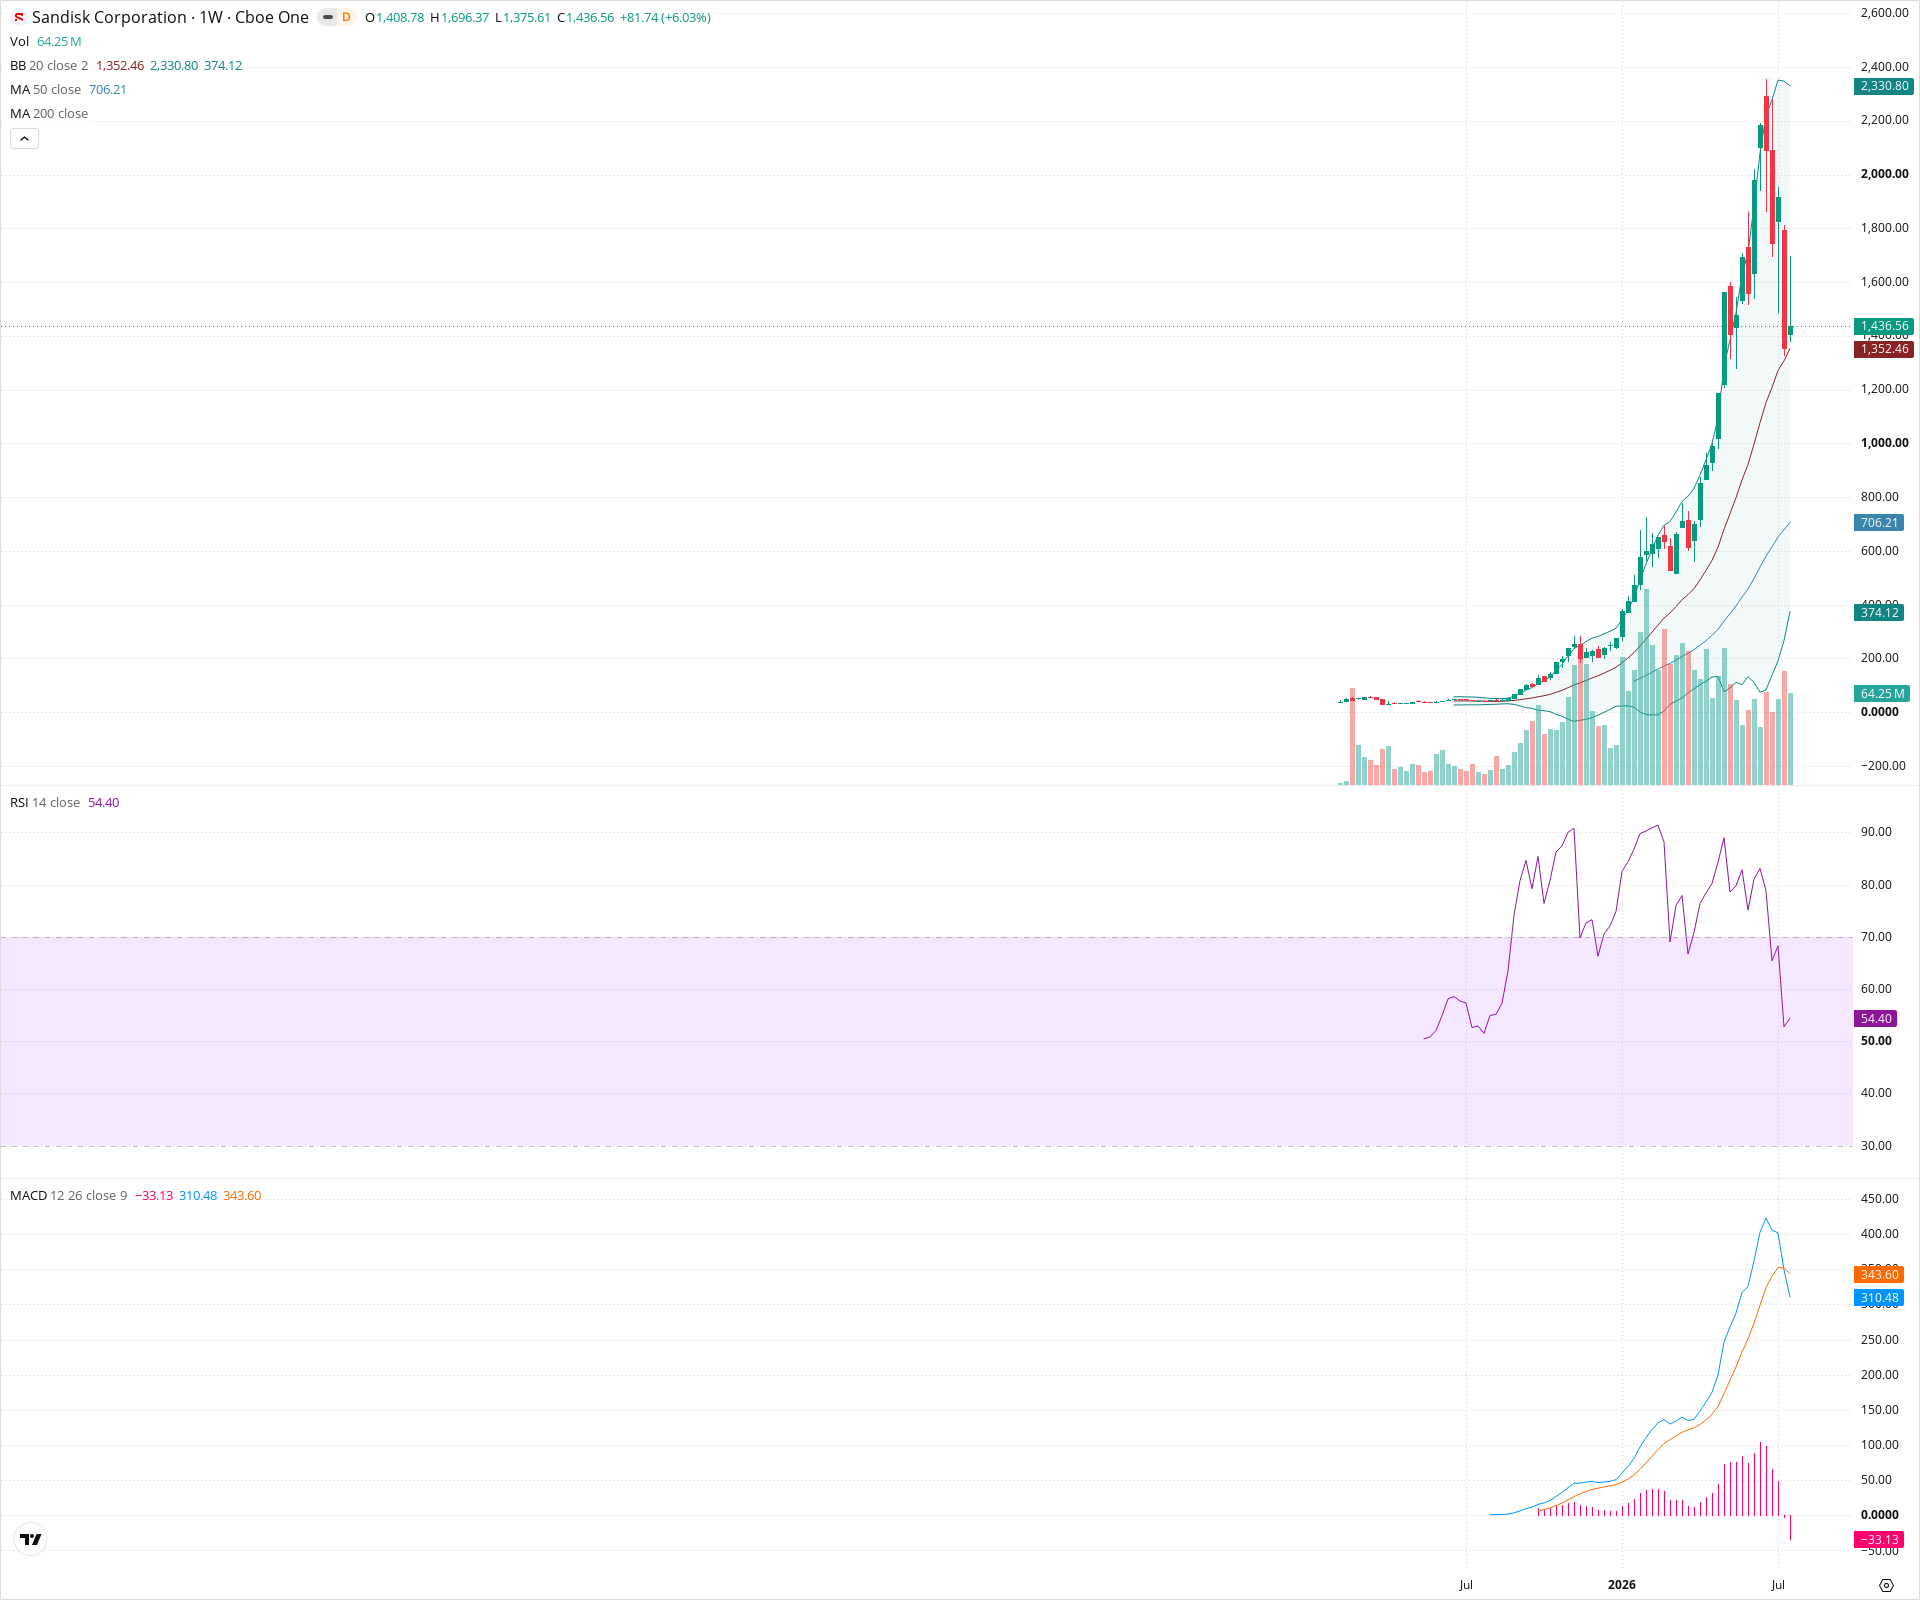
SNDK Weekly Chart
Sentiment
Short-term Sentiment (days to weeks): Bearish
The chart shows a severe multi-week pullback following a parabolic top. This is confirmed by a bearish MACD crossover with a growing negative histogram, and the RSI sharply declining from extreme overbought territory down toward the 50 level.
Long-term Sentiment (weeks to months): Bullish
Despite the current sharp correction, the broader multi-year trend remains powerfully upward. The price is still significantly elevated above the steeply rising 50-week moving average, indicating the long-term secular trend is intact.
Report Metadata
- Timeframe: weekly
- Generated at: 2026-07-25T09:07:07.998Z
- Model: gemini-3.1-pro-preview
Support Price Levels
| Level | Range | Strength | Notes |
|---|---|---|---|
| $1,375.00 | $1,350.00 - $1,400.00 | Moderate | Immediate support zone aligning with the 20-week SMA (middle Bollinger Band) which price is currently testing. |
| $950.00 | $900.00 - $1,000.00 | Strong | Major psychological level and an area of prior consolidation before the final parabolic blow-off phase. |
| $725.00 | $700.00 - $750.00 | Strong | Dynamic support level marked by the current position of the rising 50-week SMA. |
Resistance Price Levels
| Level | Range | Strength | Notes |
|---|---|---|---|
| $1,850.00 | $1,800.00 - $1,900.00 | Moderate | Near-term structural resistance formed by the consolidation and bodies of the recent large weekly distribution candles. |
| $2,350.00 | $2,300.00 - $2,400.00 | Strong | The all-time high zone representing the peak of the parabolic advance. |
Potential Chart Patterns in Formation
| Strength | Pattern | Signal | Target | Details |
|---|---|---|---|---|
| Strong | Parabolic Top Reversal | Bearish | N/A | An exponential, unsustainable price advance culminating in a climax top, followed by a sharp, multi-week high-volume breakdown, signifying a major momentum shift. |
Frequently Asked Questions about SNDK
What is the current sentiment for SNDK?
The short-term sentiment for SNDK is currently Bearish because The chart shows a severe multi-week pullback following a parabolic top. This is confirmed by a bearish MACD crossover with a growing negative histogram, and the RSI sharply declining from extreme overbought territory down toward the 50 level.. The long-term trend is classified as Bullish.
What are the key support levels for SNDK?
StockDips.AI has identified key support levels for SNDK at $1,375.00 and $950.00. These levels may represent potential accumulation zones where buying interest could emerge.
Is SNDK in a significant dip or a Value Dip right now?
SNDK has a Value Score of 55/100. It is not currently flagged as a significant dip in the Top Dips list. It is not listed as a Value Dip because the long-term sentiment or value-score threshold does not qualify.
View the full interactive analysis on StockDips.AI.