SOFI Daily Technical Analysis
SoFi Technologies Inc
Fintech offering digital banking, lending, and investing services.
SOFI Technical Analysis Summary
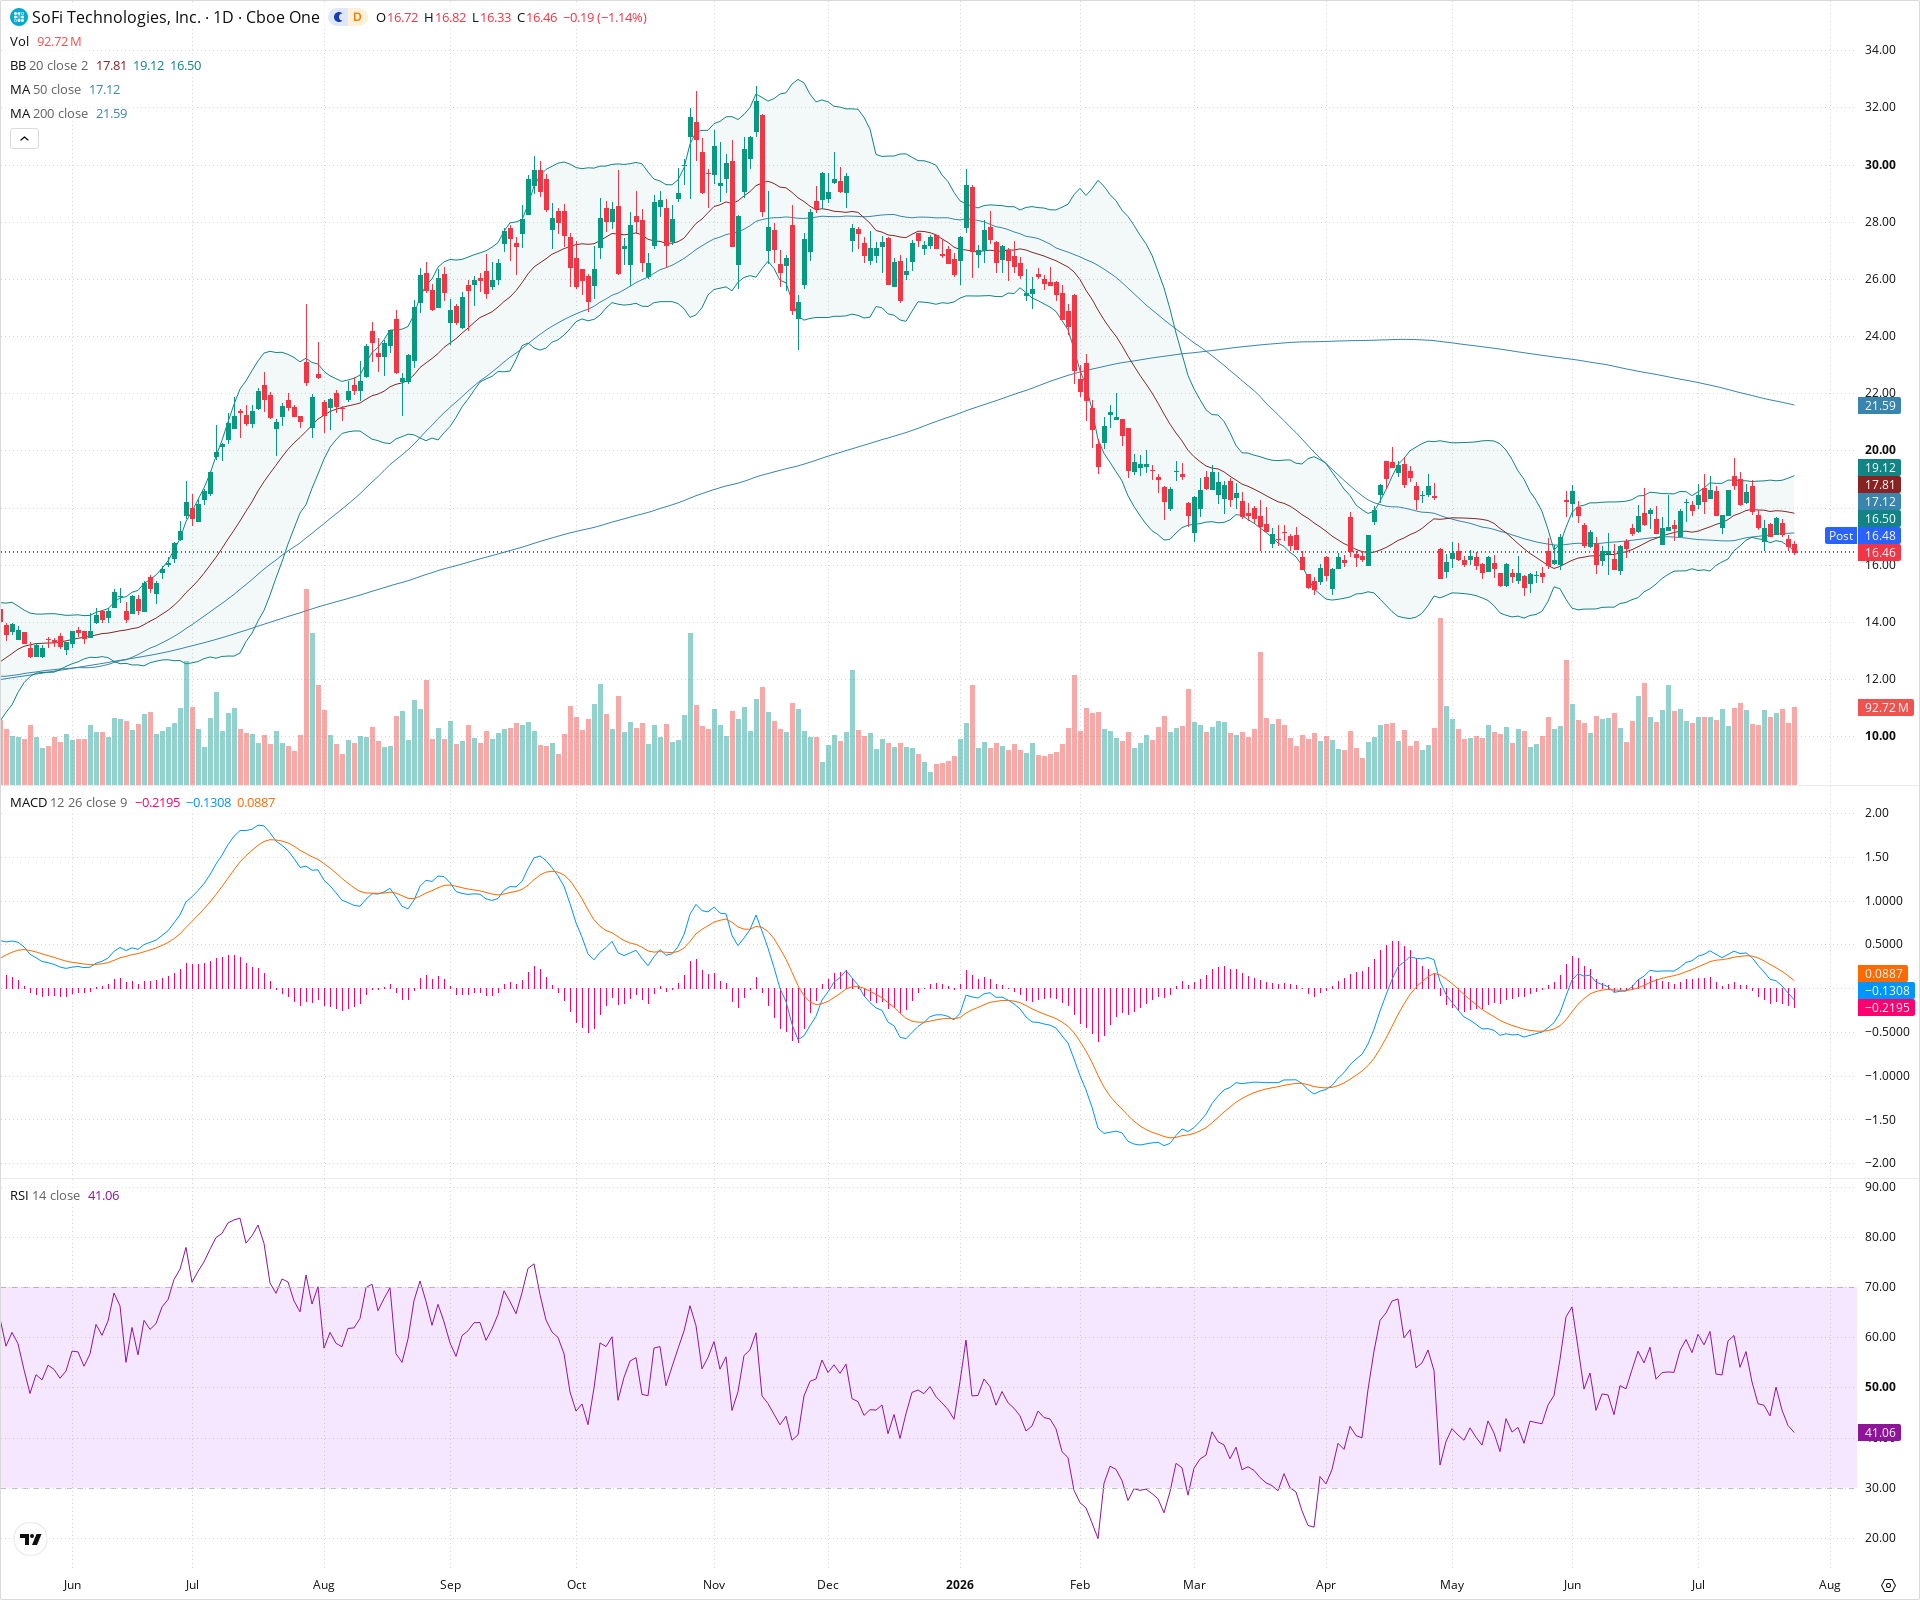
SOFI remains in a prolonged consolidation phase, attempting to build a long-term base after a significant historical decline. The stock is currently range-bound between roughly $14.50 and $20.00. In the short term, momentum has shifted bearish after a rejection at the top of this range, evidenced by price losing its 50-day moving average alongside weakening RSI and MACD indicators. Until the stock can decisively break and hold above the declining 200-day moving average, the long-term technical picture remains cautious.
Included In Lists
Related Tickers of Interest
SOFI Daily Chart
Sentiment
Short-term Sentiment (days to weeks): Bearish
Price recently rejected from range resistance near $20 and has crossed back below both the 20-day and 50-day SMAs. This downward momentum is confirmed by the RSI falling below 50 (currently ~41) and a recent bearish crossover in the MACD with an expanding negative histogram.
Long-term Sentiment (weeks to months): Bearish
The broader trend remains negative as price is trading significantly below a declining 200-day SMA. While the stock has stopped crashing and is forming a multi-month base, it has not yet demonstrated the sustained higher highs and higher lows necessary to reverse the macro downtrend.
Report Metadata
- Timeframe: daily
- Generated at: 2026-07-24T21:07:54.222Z
- Model: gemini-3.1-pro-preview
Support Price Levels
| Level | Range | Strength | Notes |
|---|---|---|---|
| $14.70 | $14.20 - $15.20 | Strong | Recent swing low zone that has acted as strong support multiple times over the past few months, forming the lower bound of the current consolidation range. |
| $12.00 | $11.50 - $12.50 | Strong | Major capitulation low formed after the steep long-term downtrend; represents critical structural support. |
Resistance Price Levels
| Level | Range | Strength | Notes |
|---|---|---|---|
| $17.45 | $17.10 - $17.80 | Weak | Immediate overhead resistance zone defined by the cluster of the 20-day and 50-day SMAs which price just broke below. |
| $20.00 | $19.50 - $20.50 | Strong | Upper boundary of the current trading range where price has been rejected multiple times recently. |
| $21.70 | $21.40 - $22.00 | Strong | Dynamic long-term resistance defined by the descending 200-day SMA. |
Potential Chart Patterns in Formation
| Strength | Pattern | Signal | Target | Details |
|---|---|---|---|---|
| Strong | Sideways Channel / Consolidation | Neutral | N/A | Price has been chopping sideways for several months, oscillating roughly between $14.50 support and $20.00 resistance. |
| Weak | Local Double Top | Bearish | $14.50 | Within the recent range, price formed two distinct peaks near $20 before selling off and breaking below intermediate support levels. |
Frequently Asked Questions about SOFI
What is the current sentiment for SOFI?
The short-term sentiment for SOFI is currently Bearish because Price recently rejected from range resistance near $20 and has crossed back below both the 20-day and 50-day SMAs. This downward momentum is confirmed by the RSI falling below 50 (currently ~41) and a recent bearish crossover in the MACD with an expanding negative histogram.. The long-term trend is classified as Bearish.
What are the key support levels for SOFI?
StockDips.AI has identified key support levels for SOFI at $14.70 and $12.00. These levels may represent potential accumulation zones where buying interest could emerge.
Is SOFI in a significant dip or a Value Dip right now?
SOFI has a Value Score of 36/100. It is not currently flagged as a significant dip in the Top Dips list. It is not listed as a Value Dip because the long-term sentiment or value-score threshold does not qualify.
View the full interactive analysis on StockDips.AI.