SPRB Daily Technical Analysis
Spruce Biosciences Inc
Spruce Biosciences focuses on developing and commercializing novel therapies for rare endocrine and neurological disorders with significant unmet medical needs.
SPRB Technical Analysis Summary
SPRB is entrenched in a severe, protracted downtrend following a massive historical price spike. The stock is currently trading below all key moving averages (20, 50, and 200 SMAs), and recent technical indicators point to continued downward drift. There are currently no visual signs of a reversal or base-building, making the long-term technical outlook highly unfavorable.
Included In Lists
Related Tickers of Interest
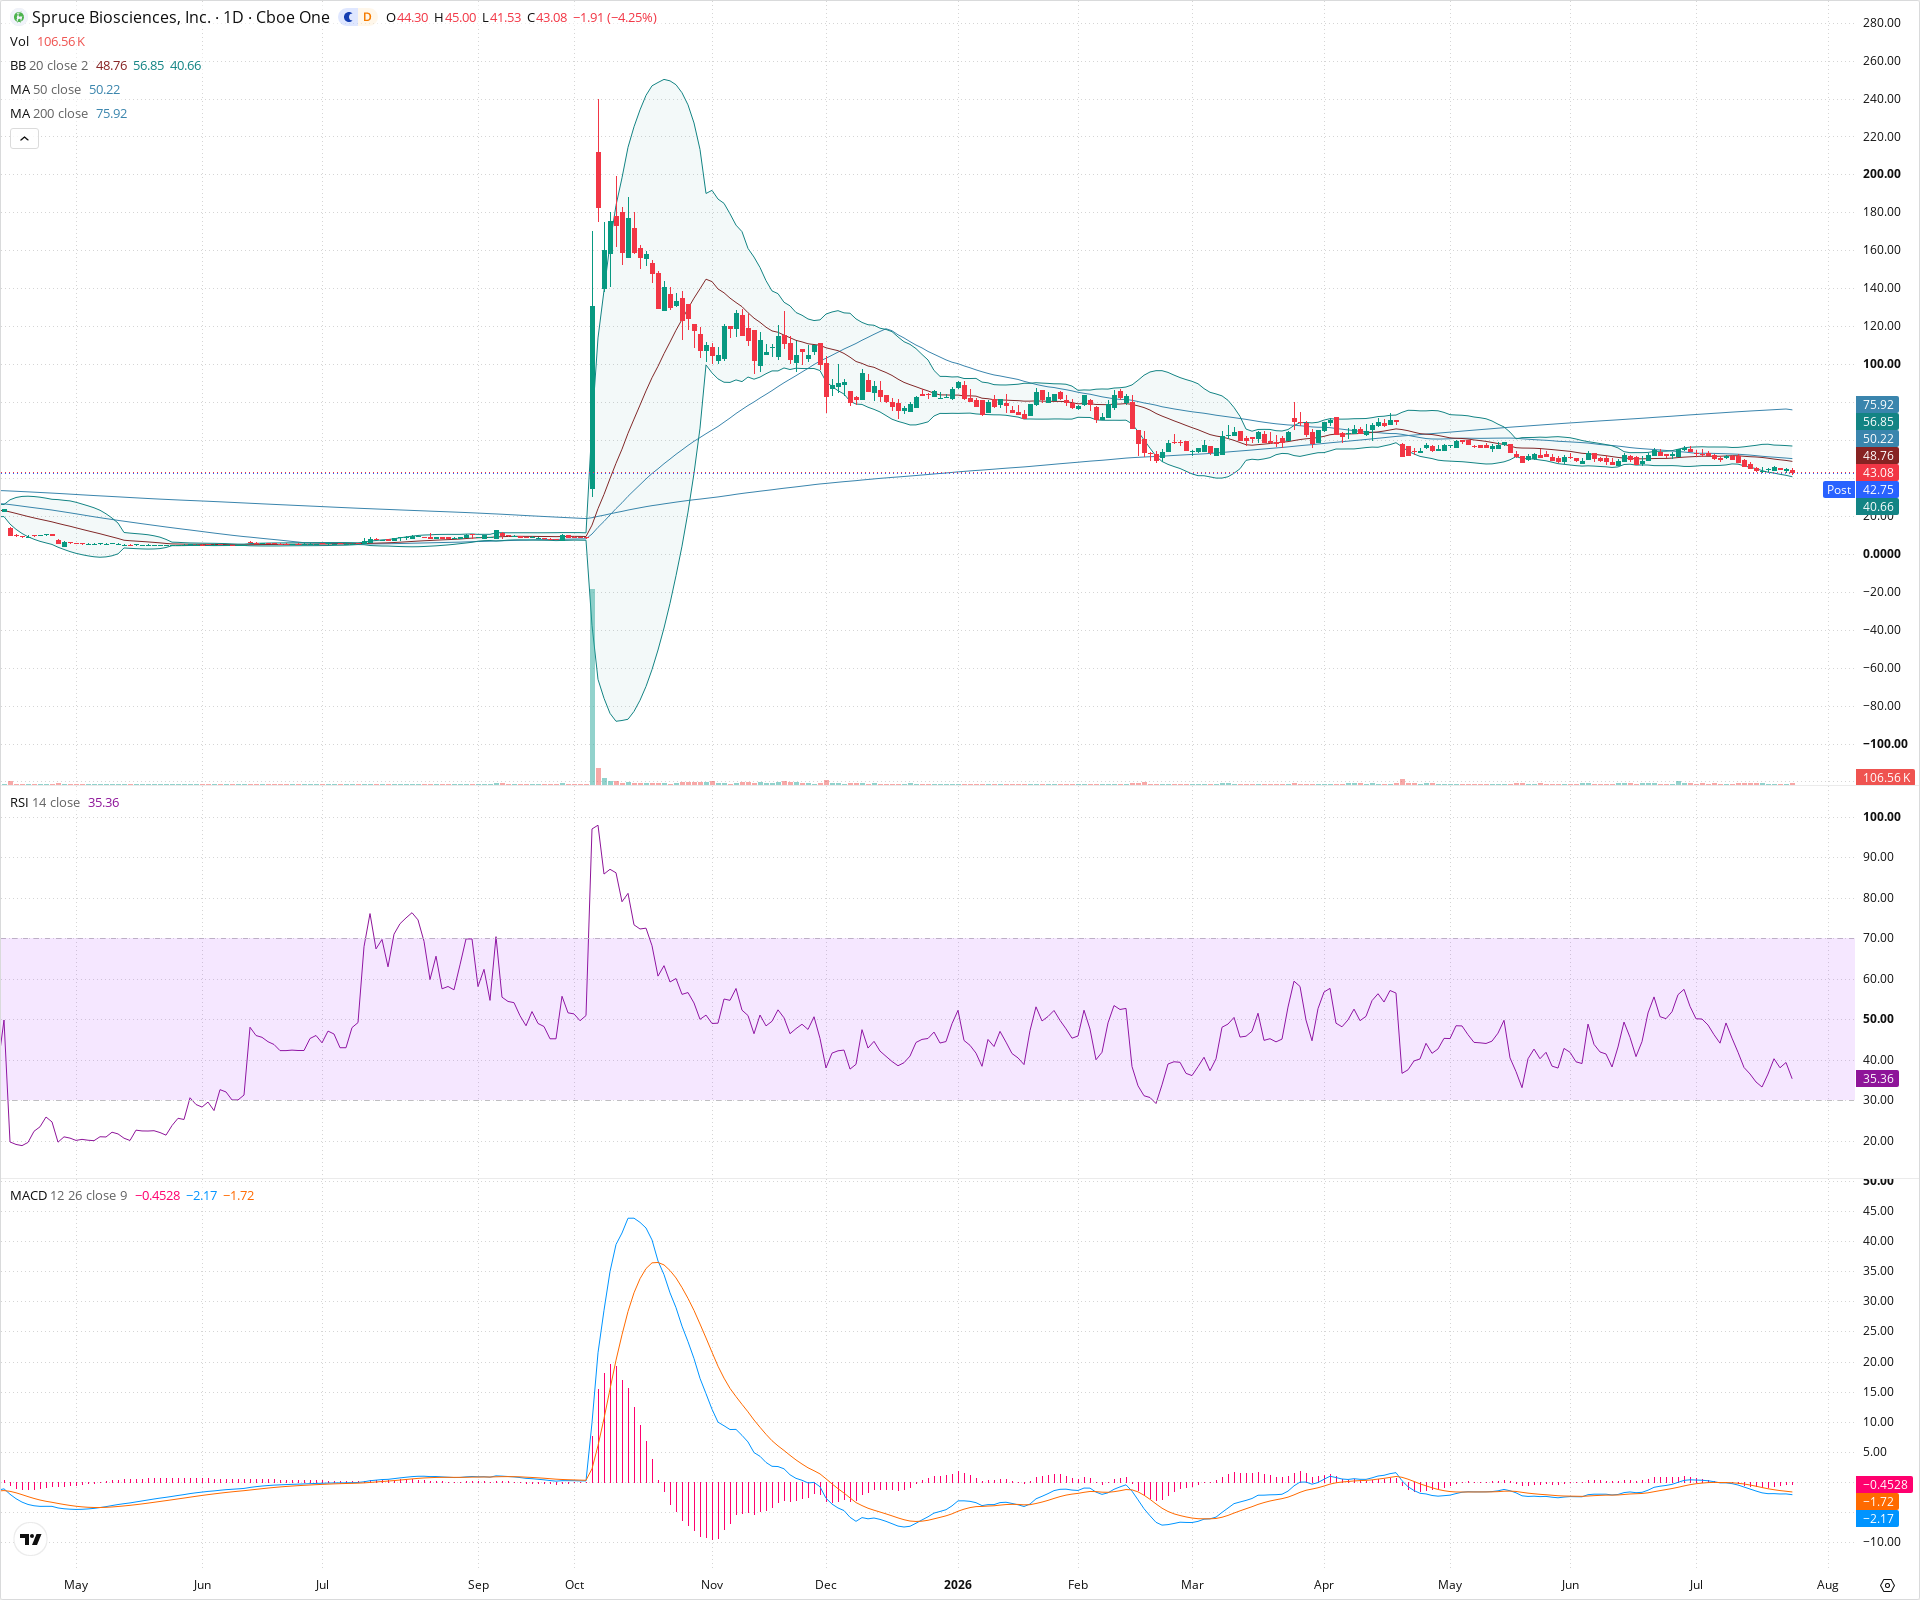
SPRB Daily Chart
Sentiment
Short-term Sentiment (days to weeks): Bearish
Price has broken below a recent consolidation zone and is trending downwards beneath both the 20 and 50 SMAs. Short-term momentum is negative, confirmed by a bearish MACD crossover and a declining RSI approaching oversold territory.
Long-term Sentiment (weeks to months): Bearish
The macro picture is defined by a massive, sustained downtrend following a historical parabolic spike. The price remains trapped well below a steeply declining 200-day SMA, indicating firm, long-term seller control.
Report Metadata
- Timeframe: daily
- Generated at: 2026-07-24T21:04:22.598Z
- Model: gemini-3.1-pro-preview
Support Price Levels
| Level | Range | Strength | Notes |
|---|---|---|---|
| $40.75 | $40.00 - $41.50 | Weak | Immediate support zone based on recent swing lows and proximity to the lower Bollinger Band. |
Resistance Price Levels
| Level | Range | Strength | Notes |
|---|---|---|---|
| $49.75 | $48.50 - $51.00 | Strong | A dense resistance zone formed by the confluence of the declining 20-day and 50-day Simple Moving Averages. |
| $75.50 | $73.00 - $78.00 | Strong | Major long-term dynamic resistance provided by the 200-day SMA. |
Potential Chart Patterns in Formation
| Strength | Pattern | Signal | Target | Details |
|---|---|---|---|---|
| Strong | Descending Channel | Bearish | N/A | Over the past several months, the price has been drifting lower within a relatively narrow, downward-sloping channel, characterized by lower highs and lower lows. |
Frequently Asked Questions about SPRB
What is the current sentiment for SPRB?
The short-term sentiment for SPRB is currently Bearish because Price has broken below a recent consolidation zone and is trending downwards beneath both the 20 and 50 SMAs. Short-term momentum is negative, confirmed by a bearish MACD crossover and a declining RSI approaching oversold territory.. The long-term trend is classified as Bearish.
What are the key support levels for SPRB?
StockDips.AI has identified key support levels for SPRB at $40.75. These levels may represent potential accumulation zones where buying interest could emerge.
Is SPRB in a significant dip or a Value Dip right now?
SPRB has a Value Score of 74/100. It is currently flagged as a significant dip in the Top Dips list. It is not listed as a Value Dip because the long-term sentiment or value-score threshold does not qualify.
View the full interactive analysis on StockDips.AI.