SPRB Weekly Technical Analysis
Spruce Biosciences Inc
Spruce Biosciences focuses on developing and commercializing novel therapies for rare endocrine and neurological disorders with significant unmet medical needs.
SPRB Technical Analysis Summary
SPRB exhibits a profoundly bearish technical structure on the weekly timeframe, characterized by a massive historical downtrend. The stock is currently trading near recent lows, well below all major moving averages, with momentum indicators like MACD and RSI confirming ongoing selling pressure. There are currently no visual indications of a long-term bottom or trend reversal.
Included In Lists
Related Tickers of Interest
SPRB Weekly Chart
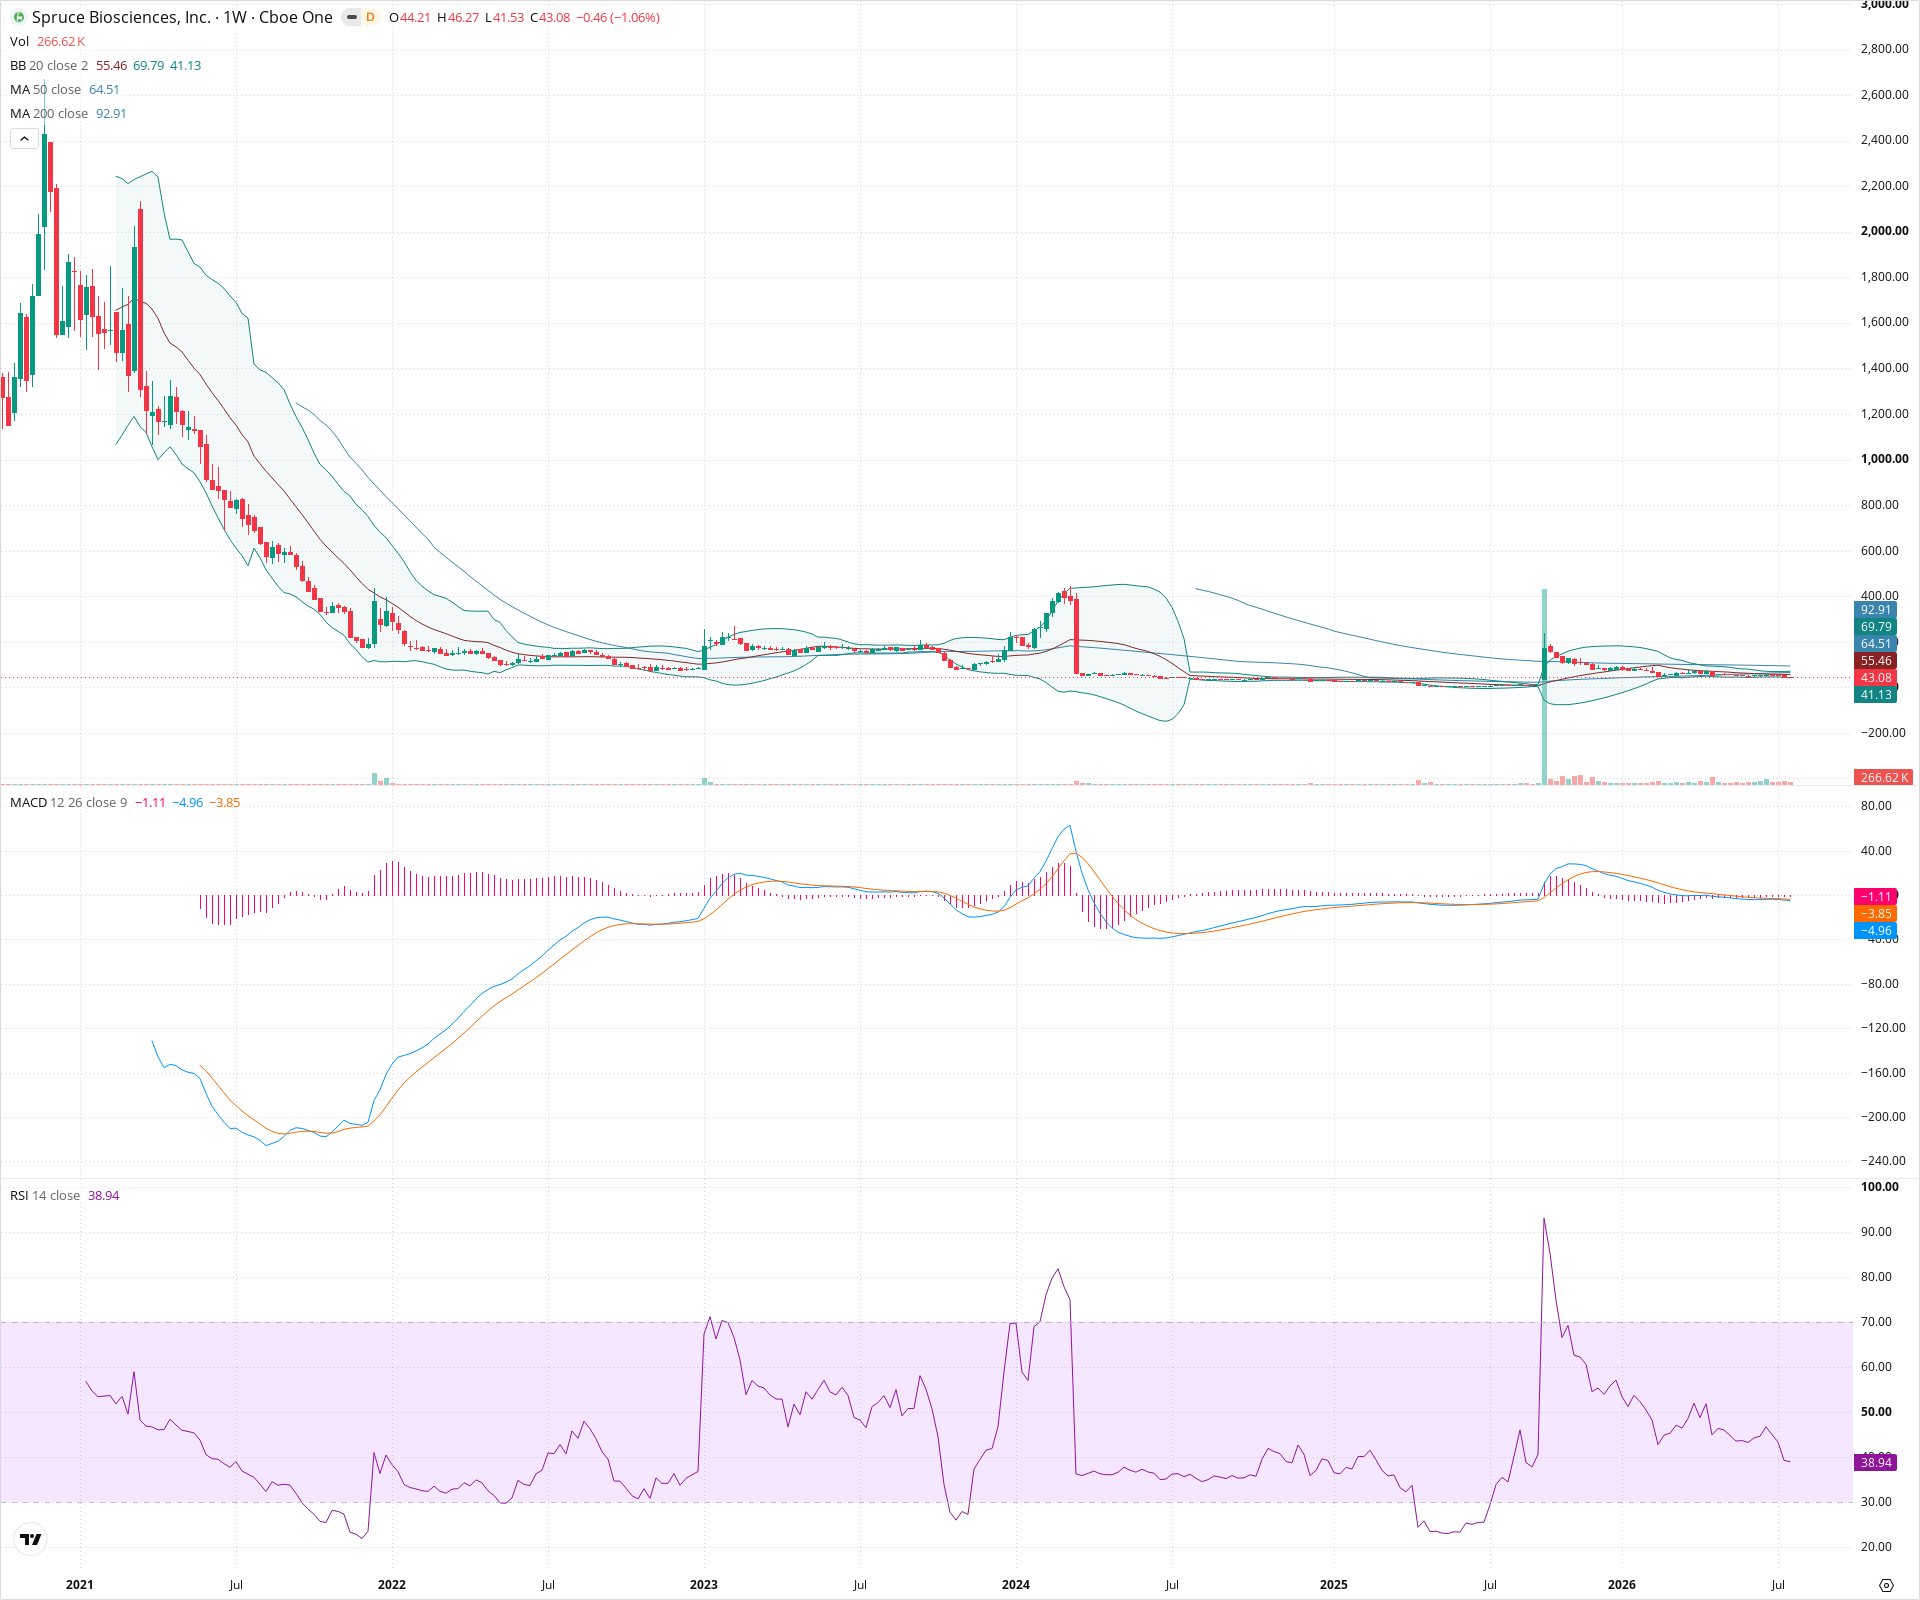
Sentiment
Short-term Sentiment (days to weeks): Bearish
Price is trending downwards below the 20-week and 50-week SMAs, with RSI in bearish territory below 40 and MACD histogram expanding negatively.
Long-term Sentiment (weeks to months): Bearish
The stock is in a severe, multi-year downtrend, trading significantly below a declining 200-week SMA following a massive historical price collapse.
Report Metadata
- Timeframe: weekly
- Generated at: 2026-07-25T09:12:18.798Z
- Model: gemini-3.1-pro-preview
Support Price Levels
| Level | Range | Strength | Notes |
|---|---|---|---|
| $38.50 | $35.00 - $42.00 | Weak | Current consolidation area near recent lows and the lower weekly Bollinger Band. |
Resistance Price Levels
| Level | Range | Strength | Notes |
|---|---|---|---|
| $60.00 | $55.00 - $65.00 | Strong | Confluence zone of the declining 20-week SMA (middle Bollinger Band) and the 50-week SMA. |
| $95.00 | $90.00 - $100.00 | Strong | Major structural resistance zone aligning with the long-term declining 200-week SMA. |
Potential Chart Patterns in Formation
| Strength | Pattern | Signal | Target | Details |
|---|---|---|---|---|
| Strong | Long-Term Downtrend | Bearish | N/A | A persistent sequence of lower highs and lower lows over multiple years, dominated by overhead supply and moving average resistance. |
Frequently Asked Questions about SPRB
What is the current sentiment for SPRB?
The short-term sentiment for SPRB is currently Bearish because Price is trending downwards below the 20-week and 50-week SMAs, with RSI in bearish territory below 40 and MACD histogram expanding negatively.. The long-term trend is classified as Bearish.
What are the key support levels for SPRB?
StockDips.AI has identified key support levels for SPRB at $38.50. These levels may represent potential accumulation zones where buying interest could emerge.
Is SPRB in a significant dip or a Value Dip right now?
SPRB has a Value Score of 74/100. It is currently flagged as a significant dip in the Top Dips list. It is not listed as a Value Dip because the long-term sentiment or value-score threshold does not qualify.
View the full interactive analysis on StockDips.AI.