TSLA Weekly Technical Analysis
Tesla Inc
Electric vehicle and clean energy company known for innovation and global EV leadership.
TSLA Technical Analysis Summary
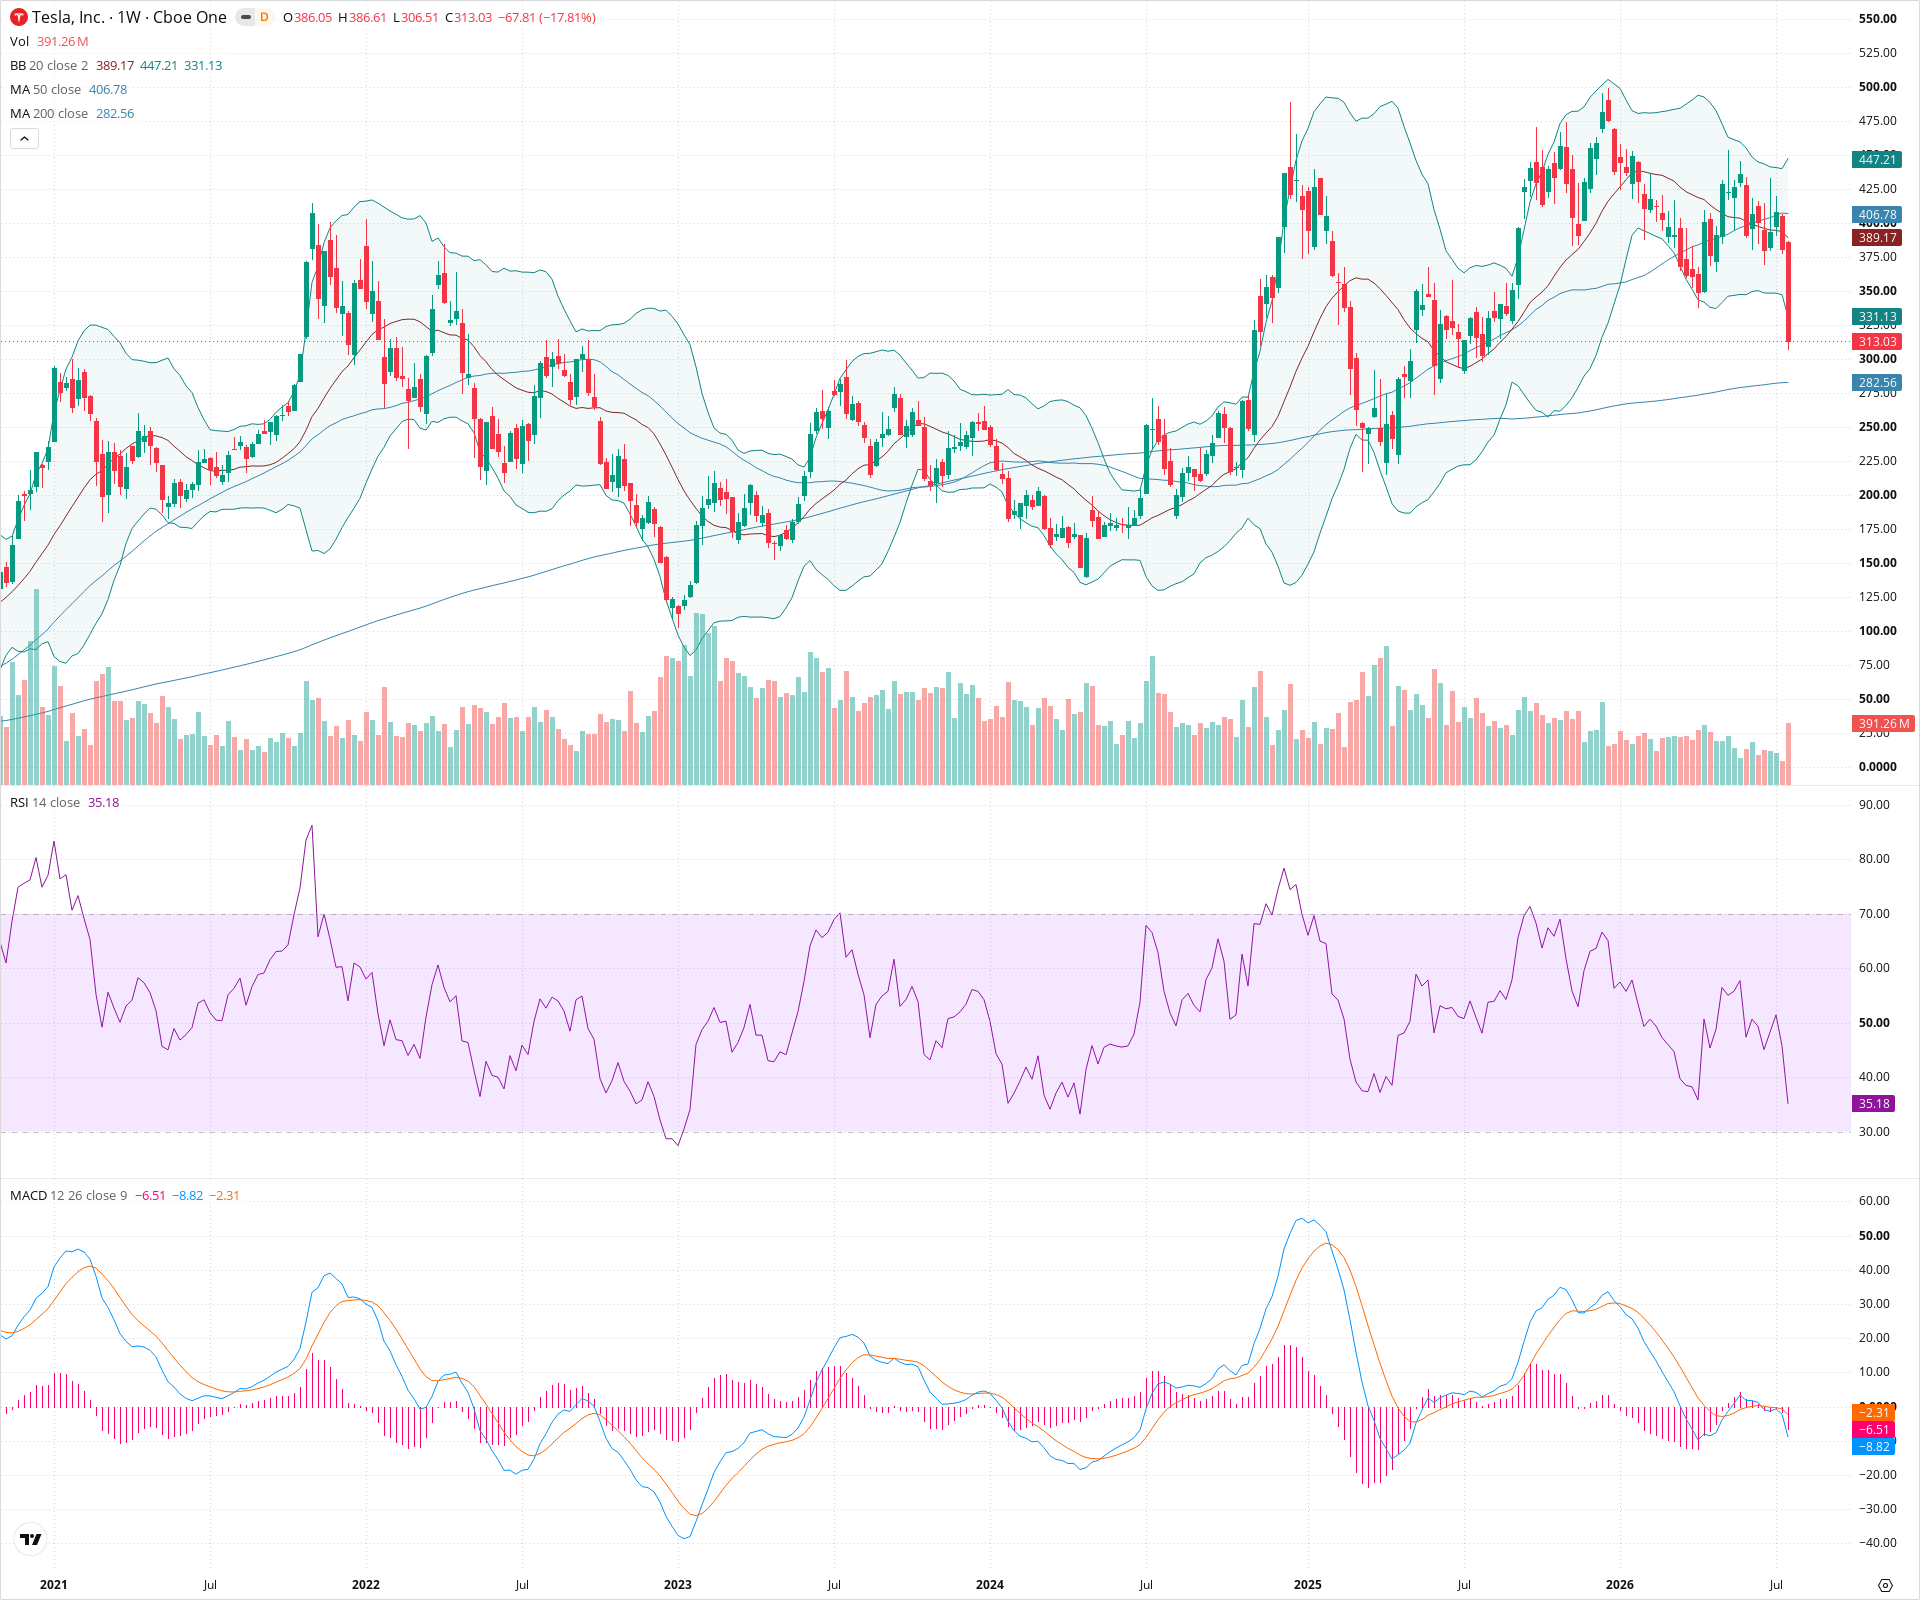
TSLA has experienced a violent technical breakdown on the weekly chart, characterized by a massive high-volume bearish engulfing candle that shattered support at the 50-week SMA. Short-term momentum is deeply negative as MACD crosses bearishly and price falls outside the lower Bollinger Band. Long-term investors should watch the critical 200-week SMA (~282) closely; holding this level is vital to maintain a neutral macro posture, while a break below would suggest a transition into a deeper structural bear market.
Included In Lists
Related Tickers of Interest
TSLA Weekly Chart
Sentiment
Short-term Sentiment (days to weeks): Bearish
Price has suffered a violent breakdown via a massive bearish weekly candle on high volume, piercing through the 50-week SMA and falling below the lower Bollinger Band. RSI is dropping sharply, and MACD has executed a bearish crossover with an expanding negative histogram.
Long-term Sentiment (weeks to months): Neutral
While the long-term trend was recovering, the severe rejection from the highs and loss of the 50-week SMA compromises the bull case. The structure remains technically intact only because price is still holding above the rising 200-week SMA.
Report Metadata
- Timeframe: weekly
- Generated at: 2026-07-25T09:14:34.299Z
- Model: gemini-3.1-pro-preview
Support Price Levels
| Level | Range | Strength | Notes |
|---|---|---|---|
| $282.50 | $275.00 - $290.00 | Strong | Confluence of the rising 200-week SMA (currently at 282.56) and previous structural support/consolidation zones. |
| $220.00 | $210.00 - $230.00 | Strong | Major structural swing low and consolidation shelf formed prior to the last significant macro rally. |
Resistance Price Levels
| Level | Range | Strength | Notes |
|---|---|---|---|
| $412.50 | $400.00 - $425.00 | Strong | Previous support turned resistance, coinciding with the broken 50-week SMA (406.78). |
| $487.50 | $475.00 - $500.00 | Strong | Recent macro peak and heavy supply zone where the latest rally was violently rejected. |
Potential Chart Patterns in Formation
| Strength | Pattern | Signal | Target | Details |
|---|---|---|---|---|
| Strong | Bearish Engulfing Breakdown | Bearish | N/A | A gigantic, high-volume red weekly candle that completely engulfs prior price action, signaling a sudden and aggressive shift in momentum from buyers to sellers. |
| Strong | Potential Macro Double Top | Bearish | N/A | The recent failure to surpass historical highs near 500, followed by this massive rejection, sets up the potential for a long-term double top if major moving average support fails. |
Frequently Asked Questions about TSLA
What is the current sentiment for TSLA?
The short-term sentiment for TSLA is currently Bearish because Price has suffered a violent breakdown via a massive bearish weekly candle on high volume, piercing through the 50-week SMA and falling below the lower Bollinger Band. RSI is dropping sharply, and MACD has executed a bearish crossover with an expanding negative histogram.. The long-term trend is classified as Neutral.
What are the key support levels for TSLA?
StockDips.AI has identified key support levels for TSLA at $282.50 and $220.00. These levels may represent potential accumulation zones where buying interest could emerge.
Is TSLA in a significant dip or a Value Dip right now?
TSLA has a Value Score of 74/100. It is currently flagged as a significant dip in the Top Dips list. It is not listed as a Value Dip because the long-term sentiment or value-score threshold does not qualify.
View the full interactive analysis on StockDips.AI.