UNG Weekly Technical Analysis
United States Natural Gas Fund
Tracks the price of natural gas futures contracts. Natural gas is used for electricity generation, heating, and industrial production. Prices are highly volatile and sensitive to weather patterns, storage levels, and seasonal demand.
UNG Technical Analysis Summary
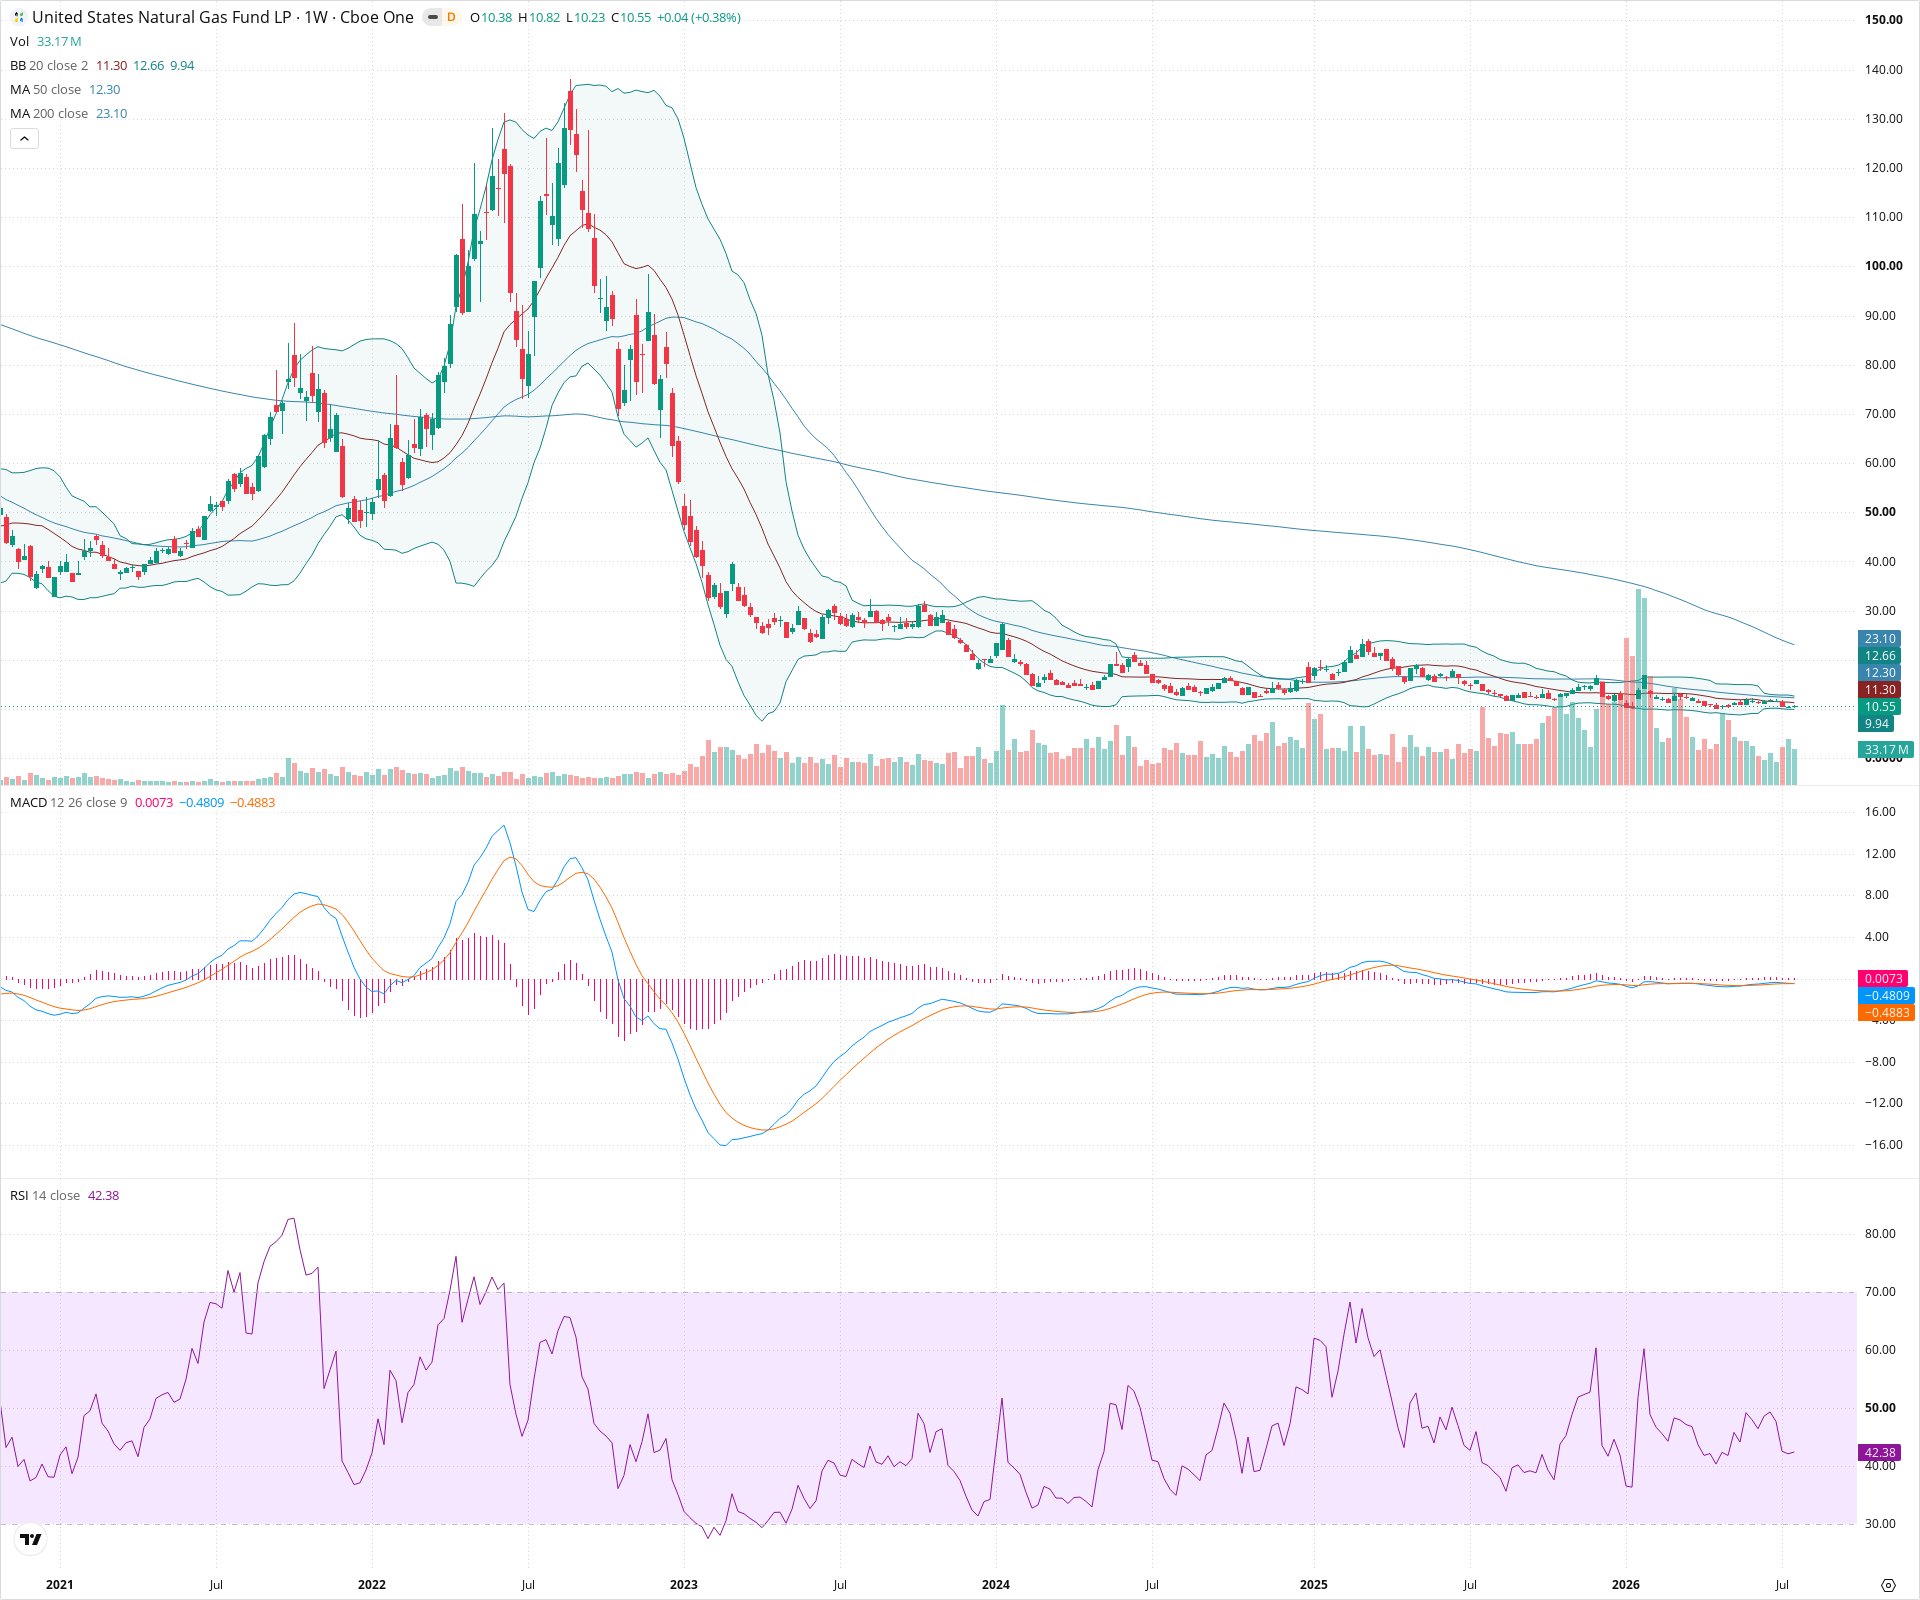
UNG remains firmly entrenched in a severe long-term downtrend, characterized by price action well below a declining 200-week SMA. The asset has recently settled into a prolonged period of sideways consolidation at extreme lows, with momentum indicators like MACD completely flatlining. A decisive weekly close above the 50-week SMA is required to suggest any meaningful shift in near-term character, while a breakdown below $9.50 would signal trend continuation.
Included In Lists
Related Tickers of Interest
UNG Weekly Chart
Sentiment
Short-term Sentiment (days to weeks): Bearish
Price is trading below the 20-week and 50-week SMAs with RSI below 50, indicating continued sluggishness despite sideways action.
Long-term Sentiment (weeks to months): Bearish
The long-term structure is a massive downtrend, with the price remaining significantly below a steep, downward-sloping 200-week SMA.
Report Metadata
- Timeframe: weekly
- Generated at: 2026-07-25T09:11:30.801Z
- Model: gemini-3.1-pro-preview
Support Price Levels
| Level | Range | Strength | Notes |
|---|---|---|---|
| $9.75 | $9.50 - $10.00 | Strong | Recent multi-month swing lows establishing a floor. |
Resistance Price Levels
| Level | Range | Strength | Notes |
|---|---|---|---|
| $11.90 | $11.30 - $12.50 | Strong | Confluence of the 20-week and 50-week SMAs acting as dynamic resistance. |
| $14.50 | $14.00 - $15.00 | Weak | Previous consolidation highs acting as overhead supply. |
Potential Chart Patterns in Formation
| Strength | Pattern | Signal | Target | Details |
|---|---|---|---|---|
| Strong | Sideways Consolidation | Neutral | N/A | Price has been trapped in a prolonged, flat range at extreme lows following a massive historical sell-off, with MACD flatlining around the zero line. |
Frequently Asked Questions about UNG
What is the current sentiment for UNG?
The short-term sentiment for UNG is currently Bearish because Price is trading below the 20-week and 50-week SMAs with RSI below 50, indicating continued sluggishness despite sideways action.. The long-term trend is classified as Bearish.
What are the key support levels for UNG?
StockDips.AI has identified key support levels for UNG at $9.75. These levels may represent potential accumulation zones where buying interest could emerge.
Is UNG in a significant dip or a Value Dip right now?
UNG has a Value Score of 42/100. It is not currently flagged as a significant dip in the Top Dips list. It is not listed as a Value Dip because the long-term sentiment or value-score threshold does not qualify.
View the full interactive analysis on StockDips.AI.