URA Weekly Technical Analysis
Global X Uranium ETF
Provides exposure to companies involved in uranium mining, nuclear fuel production, and nuclear energy infrastructure. Uranium demand is driven by global nuclear power adoption, energy security concerns, and decarbonization initiatives.
URA Technical Analysis Summary
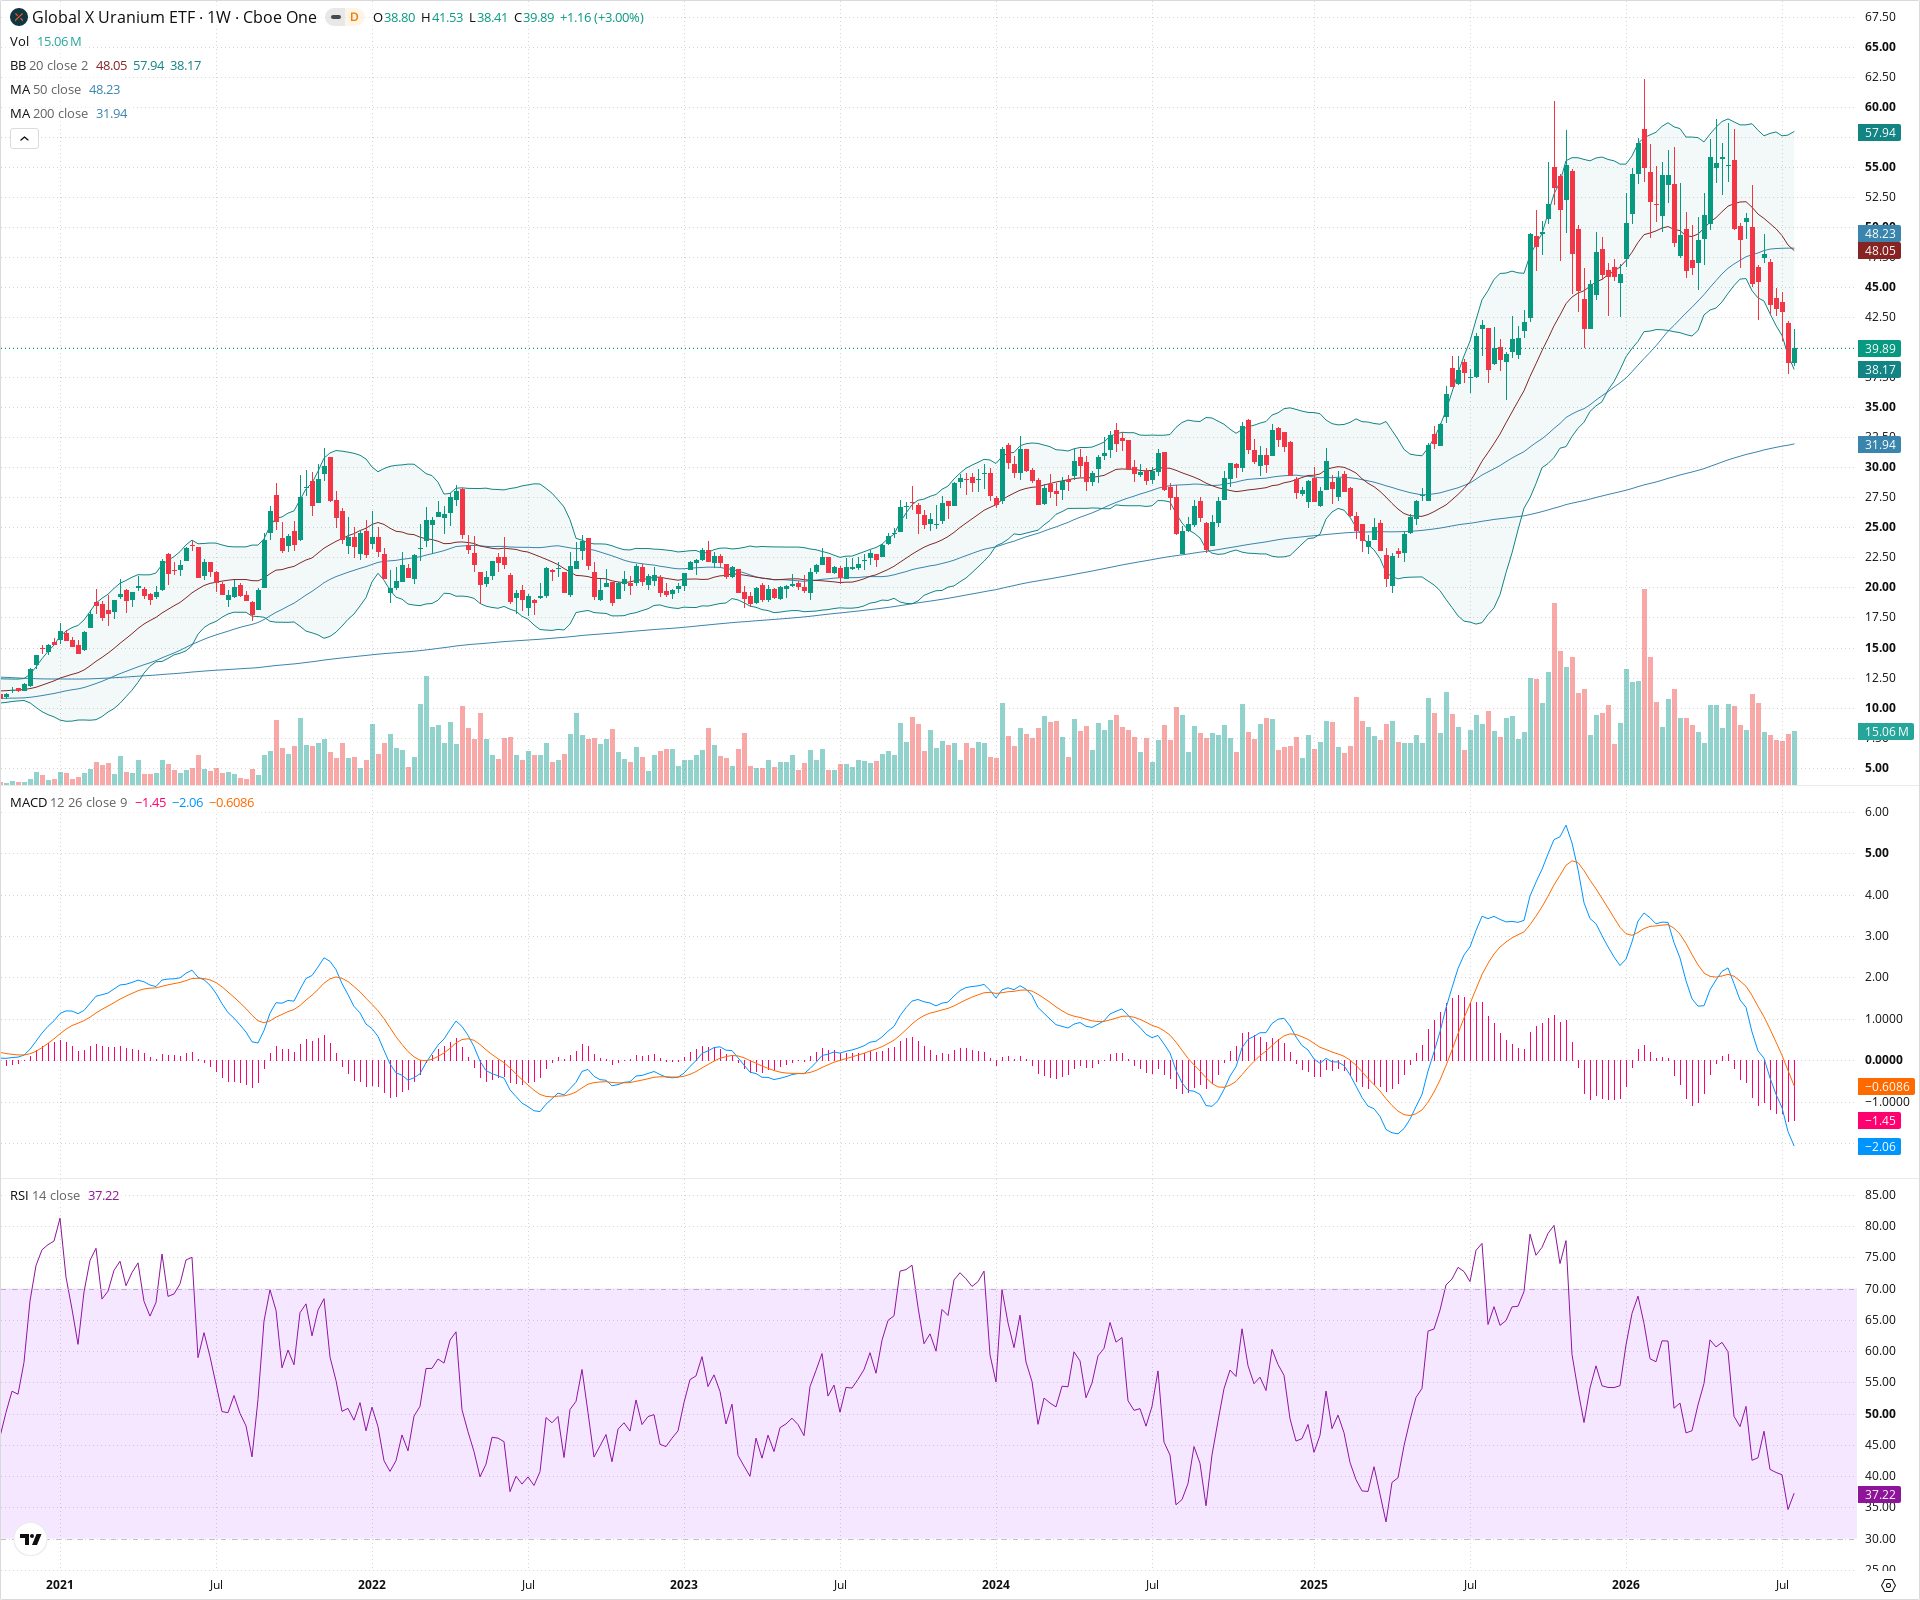
URA has suffered a major technical breakdown on the weekly chart, completing a large topping pattern and aggressively slicing through the 50-week SMA support. Short-to-medium term momentum is firmly negative, as confirmed by a steeply dropping MACD. While a short-term oversold bounce is possible near the lower Bollinger Band, the broader technical picture will remain challenged until it can reclaim the $48-$50 resistance zone. Long-term investors should watch the critical $30-$33 support area, anchored by the 200-week SMA, as a failure there would signal a major structural trend reversal.
Included In Lists
Related Tickers of Interest
URA Weekly Chart
Sentiment
Short-term Sentiment (days to weeks): Bearish
Price has decisively broken below the 50-week SMA on increased volume. The MACD line has crossed below the signal line and the zero line, with expanding negative momentum on the histogram.
Long-term Sentiment (weeks to months): Neutral
While the recent breakdown is severe and has damaged the medium-term uptrend, the price remains above the rising 200-week SMA. The long-term structural higher-low framework is under pressure but not yet invalidated.
Report Metadata
- Timeframe: weekly
- Generated at: 2026-07-25T09:10:55.299Z
- Model: gemini-3.1-pro-preview
Support Price Levels
| Level | Range | Strength | Notes |
|---|---|---|---|
| $38.75 | $37.50 - $40.00 | Weak | Immediate support zone where price is currently finding a bounce, aligning with the lower weekly Bollinger Band. |
| $31.50 | $30.00 - $33.00 | Strong | Major structural support zone. This area contains significant previous consolidation and aligns closely with the currently rising 200-week SMA (~31.94). |
Resistance Price Levels
| Level | Range | Strength | Notes |
|---|---|---|---|
| $48.00 | $47.00 - $49.00 | Strong | Previous support turned resistance. This zone contains the confluence of the declining 20-week and 50-week SMAs. |
| $60.00 | $58.00 - $62.00 | Strong | Major structural resistance defined by the recent multi-week topping pattern and historical highs. |
Potential Chart Patterns in Formation
| Strength | Pattern | Signal | Target | Details |
|---|---|---|---|---|
| Strong | Topping Pattern Breakdown | Bearish | $36.00 | Price formed a multi-month double top or complex topping structure between 58 and 62. It recently broke below the neckline support (around 47-48) on high volume, initiating a steep corrective phase. |
Frequently Asked Questions about URA
What is the current sentiment for URA?
The short-term sentiment for URA is currently Bearish because Price has decisively broken below the 50-week SMA on increased volume. The MACD line has crossed below the signal line and the zero line, with expanding negative momentum on the histogram.. The long-term trend is classified as Neutral.
What are the key support levels for URA?
StockDips.AI has identified key support levels for URA at $38.75 and $31.50. These levels may represent potential accumulation zones where buying interest could emerge.
Is URA in a significant dip or a Value Dip right now?
URA has a Value Score of 93/100. It is currently flagged as a significant dip in the Top Dips list. It is not listed as a Value Dip because the long-term sentiment or value-score threshold does not qualify.
View the full interactive analysis on StockDips.AI.