USO Weekly Technical Analysis
United States Oil Fund
Designed to track the daily price movements of West Texas Intermediate (WTI) crude oil using futures contracts. Oil prices are driven by global supply and demand, OPEC policy, geopolitics, and economic growth expectations.
USO Technical Analysis Summary
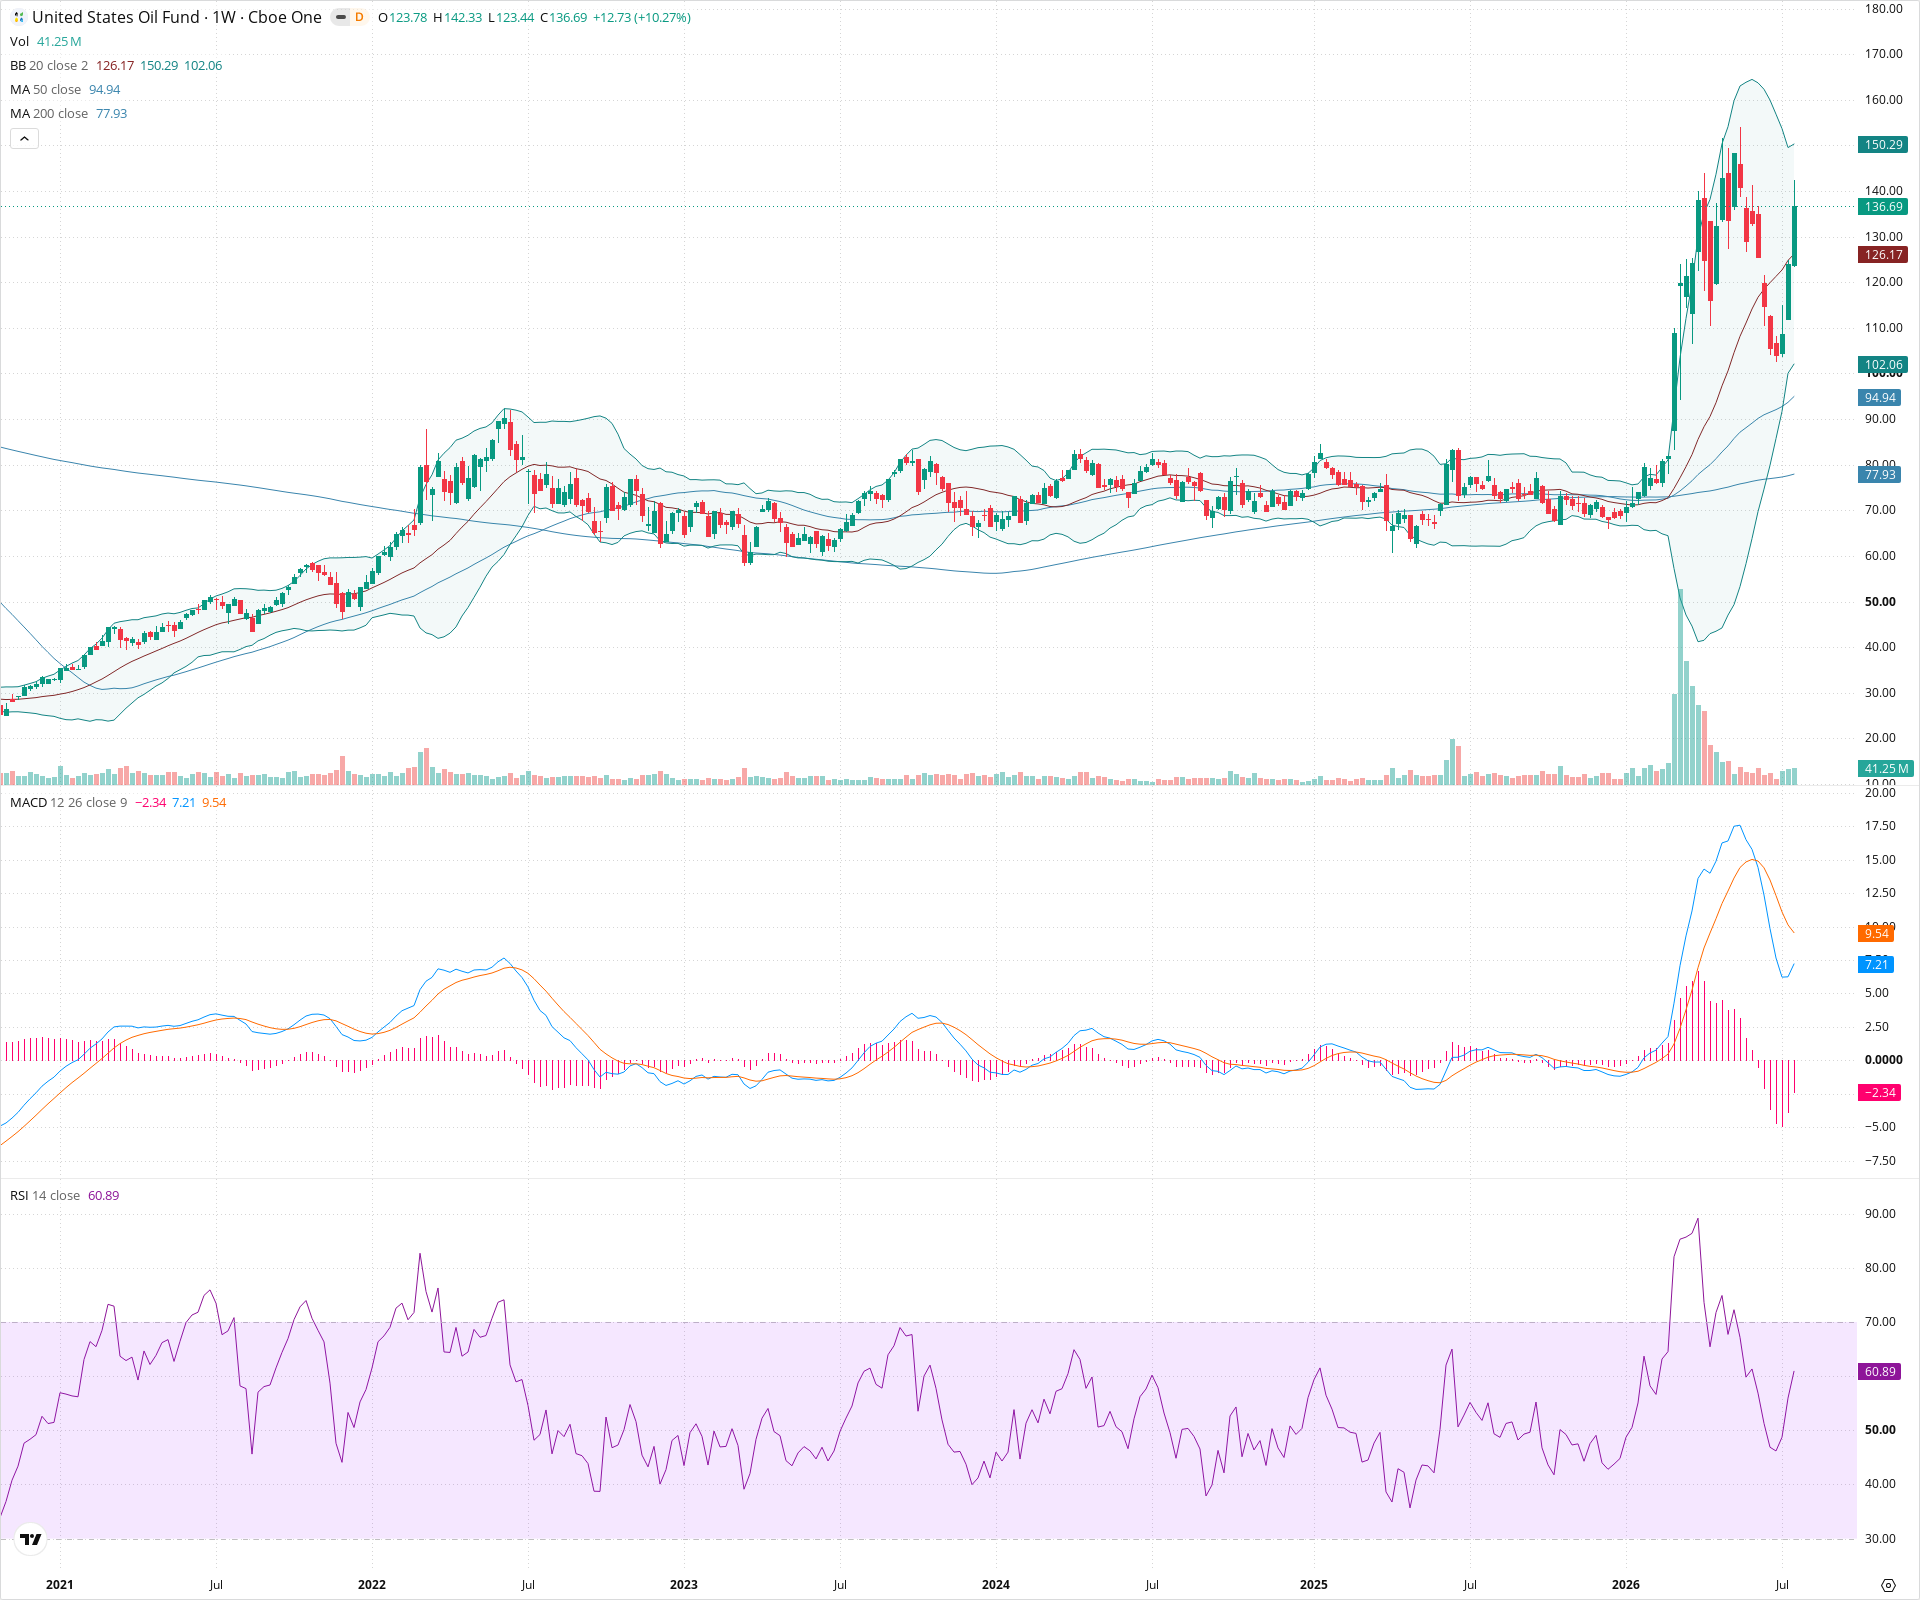
USO is in a well-established, multi-year structural uptrend. After a significant run-up and subsequent pullback to the 50-week SMA, the price has formed a strong bullish reversal candle, breaking back above the 20-week SMA. With RSI turning back up and moving averages positively aligned, the technical picture suggests a resumption of the primary uptrend toward recent highs.
Included In Lists
Related Tickers of Interest
USO Weekly Chart
Sentiment
Short-term Sentiment (days to weeks): Bullish
Price is rebounding off the 50-week SMA, breaking back above the 20-week SMA, and RSI has turned up sharply above 50, indicating resumed momentum following a pullback.
Long-term Sentiment (weeks to months): Bullish
The chart shows a strong multi-year uptrend with the 50-week SMA well above the 200-week SMA, and price consistently finding support near the 50-week SMA during corrective phases.
Report Metadata
- Timeframe: weekly
- Generated at: 2026-07-25T09:10:32.599Z
- Model: gemini-3.1-pro-preview
Support Price Levels
| Level | Range | Strength | Notes |
|---|---|---|---|
| $127.00 | $126.00 - $128.00 | Weak | Immediate support at the 20-week SMA. |
| $112.50 | $110.00 - $115.00 | Strong | Recent major swing low area converging with the rising 50-week SMA. |
| $95.00 | $94.00 - $96.00 | Strong | Previous major consolidation low and proximity to the 200-week SMA. |
Resistance Price Levels
| Level | Range | Strength | Notes |
|---|---|---|---|
| $147.50 | $145.00 - $150.00 | Strong | Recent multi-year highs and upper Bollinger Band area. |
| $162.50 | $160.00 - $165.00 | Weak | Next major psychological level above recent highs. |
Potential Chart Patterns in Formation
| Strength | Pattern | Signal | Target | Details |
|---|---|---|---|---|
| Strong | Bull Flag / Consolidation Breakout | Bullish | $150.00 | Price recently formed a significant corrective flag/channel pattern off the highs and has shown a strong bullish weekly candle breaking back upward. |
Frequently Asked Questions about USO
What is the current sentiment for USO?
The short-term sentiment for USO is currently Bullish because Price is rebounding off the 50-week SMA, breaking back above the 20-week SMA, and RSI has turned up sharply above 50, indicating resumed momentum following a pullback.. The long-term trend is classified as Bullish.
What are the key support levels for USO?
StockDips.AI has identified key support levels for USO at $127.00 and $112.50. These levels may represent potential accumulation zones where buying interest could emerge.
Is USO in a significant dip or a Value Dip right now?
USO has a Value Score of 22/100. It is not currently flagged as a significant dip in the Top Dips list. It is not listed as a Value Dip because the long-term sentiment or value-score threshold does not qualify.
View the full interactive analysis on StockDips.AI.