V Weekly Technical Analysis
Visa
World’s leading digital payments network enabling global card transactions.
V Technical Analysis Summary
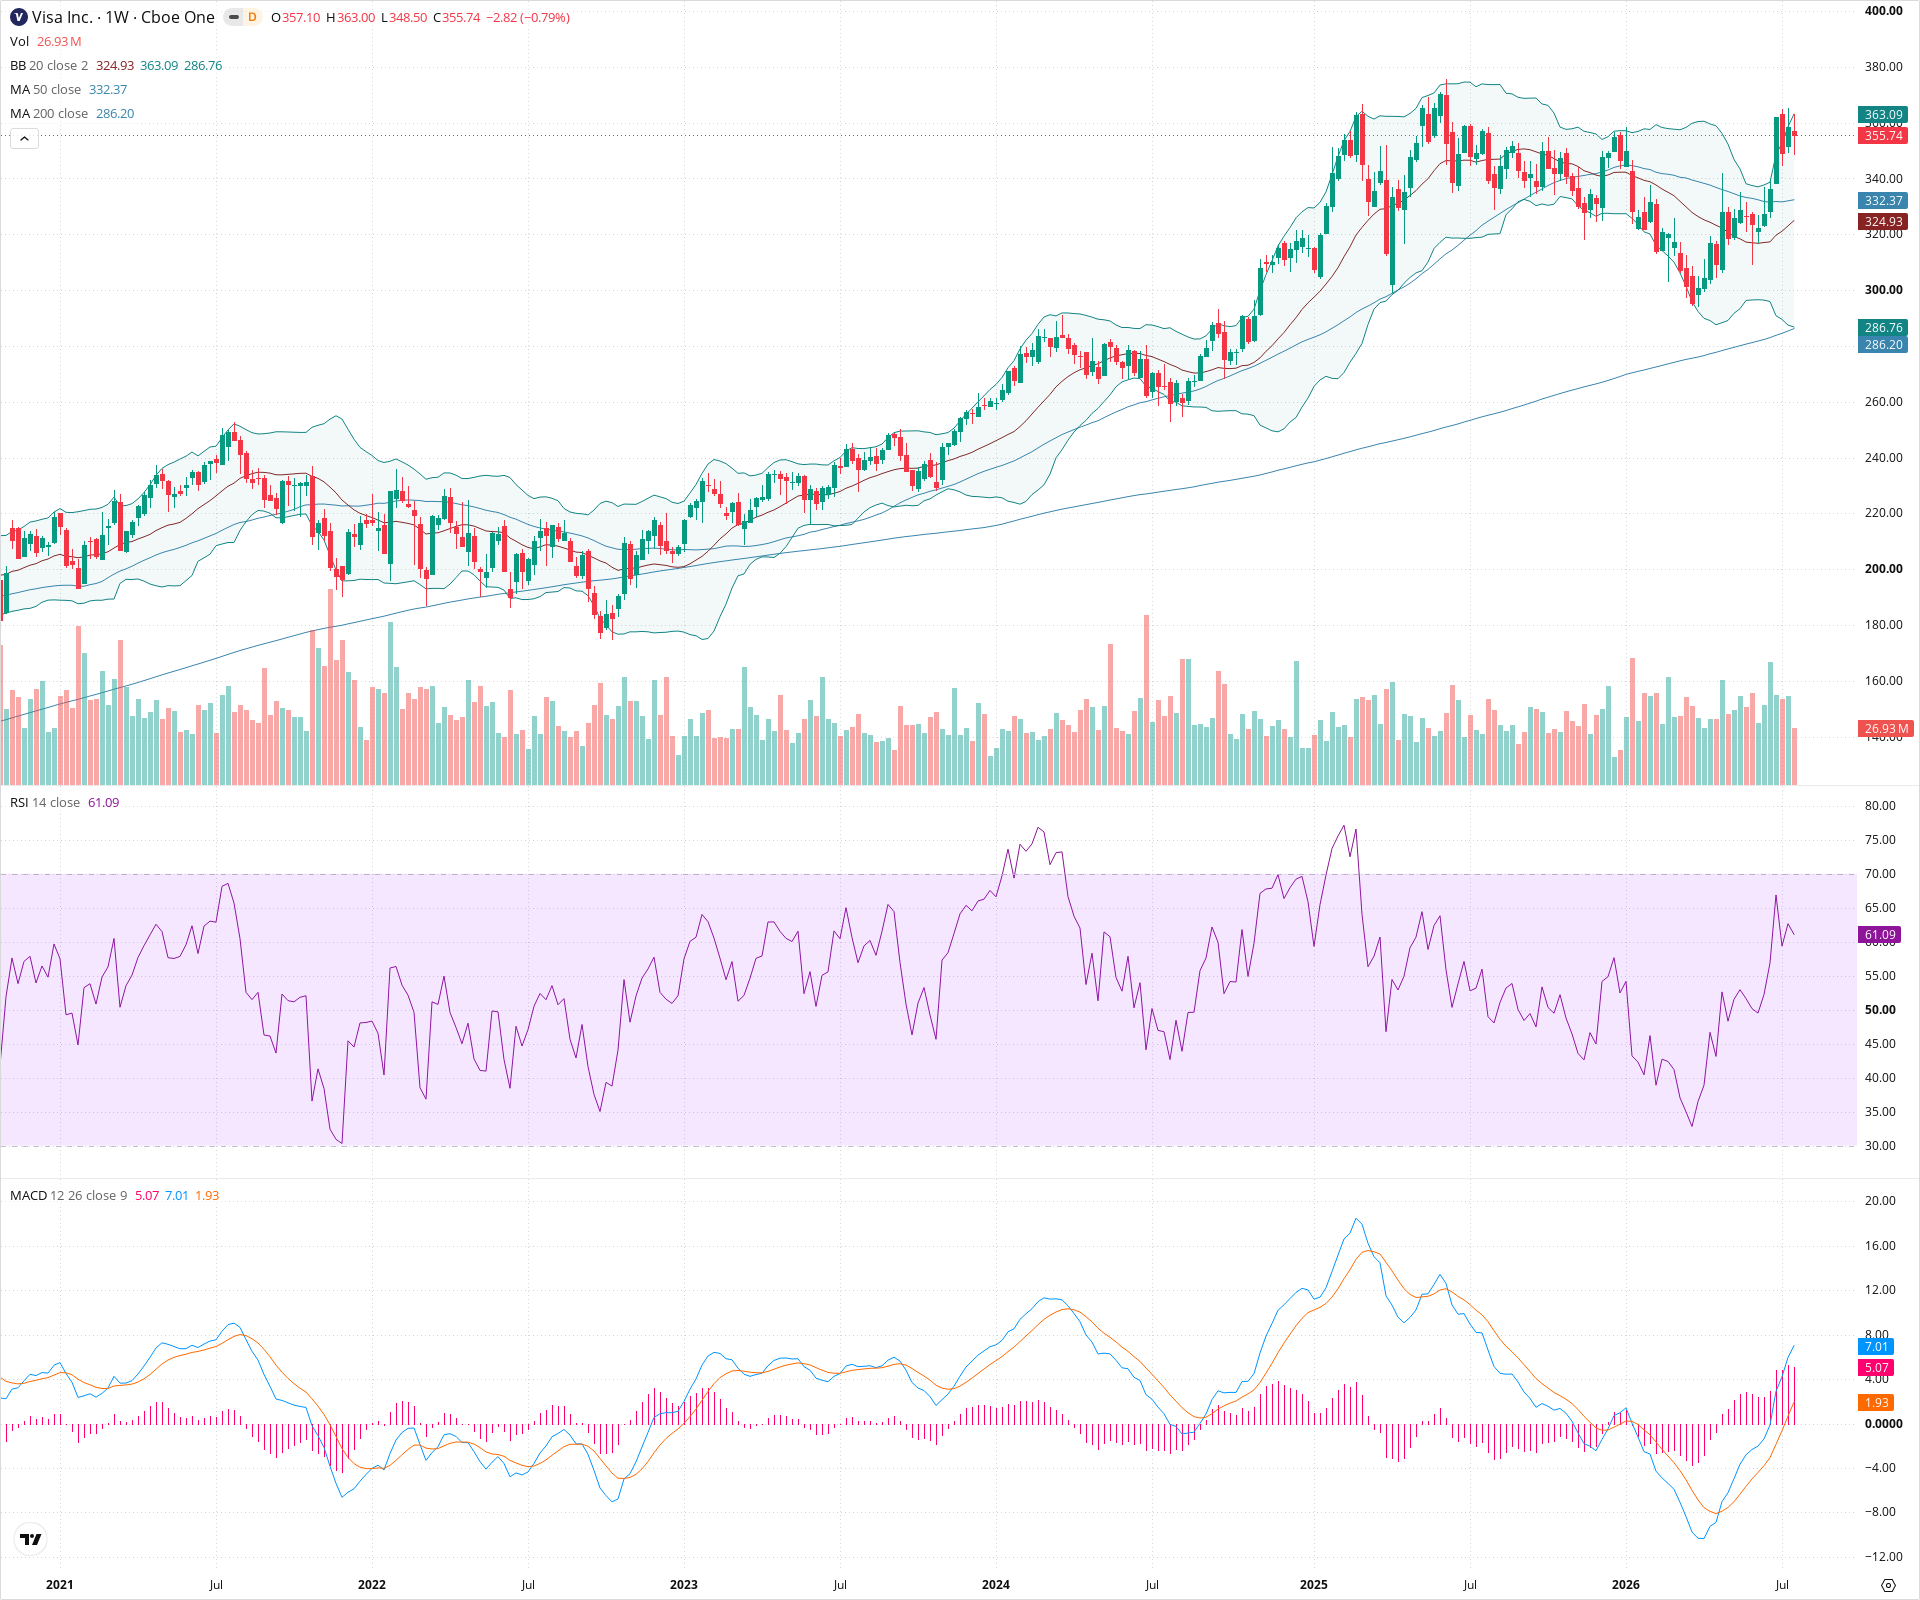
Visa (V) remains in a structurally powerful long-term uptrend on the weekly timeframe, evidenced by its position far above rising major moving averages. The current price action reflects a healthy consolidation or minor pullback following a recent advance to new all-time highs near 380. While short-term momentum has paused as indicated by a cooling RSI, the broader technical structure strongly favors continued upward progression once this consolidation phase resolves.
Included In Lists
Related Tickers of Interest
V Weekly Chart
Sentiment
Short-term Sentiment (days to weeks): Neutral
Price is experiencing a standard pullback from recent all-time highs, briefly dipping below the 20-week SMA while RSI cools from overbought territory.
Long-term Sentiment (weeks to months): Bullish
The stock is in a persistent, multi-year uptrend with price holding well above the rising 50-week and 200-week SMAs, establishing consistent higher highs and higher lows.
Report Metadata
- Timeframe: weekly
- Generated at: 2026-07-25T09:03:16.899Z
- Model: gemini-3.1-pro-preview
Support Price Levels
| Level | Range | Strength | Notes |
|---|---|---|---|
| $337.00 | $332.00 - $342.00 | Strong | Confluence of recent swing lows and dynamic support from the rising 50-week SMA. |
| $290.50 | $286.00 - $295.00 | Strong | Major historical consolidation zone acting as underlying support, closely aligned with the 200-week SMA. |
Resistance Price Levels
| Level | Range | Strength | Notes |
|---|---|---|---|
| $380.00 | $375.00 - $385.00 | Strong | Recent all-time high zone where the latest rally met selling pressure. |
| $400.00 | $400.00 - $400.00 | Weak | Psychological whole number resistance level in uncharted territory. |
Potential Chart Patterns in Formation
| Strength | Pattern | Signal | Target | Details |
|---|---|---|---|---|
| Strong | Ascending Channel / Uptrend | Bullish | N/A | A clear, established multi-year sequence of higher highs and higher lows, dictating the primary bullish bias. |
Frequently Asked Questions about V
What is the current sentiment for V?
The short-term sentiment for V is currently Neutral because Price is experiencing a standard pullback from recent all-time highs, briefly dipping below the 20-week SMA while RSI cools from overbought territory.. The long-term trend is classified as Bullish.
What are the key support levels for V?
StockDips.AI has identified key support levels for V at $337.00 and $290.50. These levels may represent potential accumulation zones where buying interest could emerge.
Is V in a significant dip or a Value Dip right now?
V has a Value Score of 62/100. It is not currently flagged as a significant dip in the Top Dips list. It is not listed as a Value Dip because the long-term sentiment or value-score threshold does not qualify.
View the full interactive analysis on StockDips.AI.