BABA Weekly Technical Analysis
Alibaba Group
One of China’s largest technology companies, operating e-commerce (Taobao, Tmall), cloud computing (Alibaba Cloud), logistics, and digital payments (Alipay ecosystem).
BABA Technical Analysis Summary
BABA is exhibiting significant technical weakness on the weekly timeframe following a major breakdown below key structural support near $120. While the price is currently approaching a critical long-term support zone at the 200-week SMA ($104 area), momentum indicators remain heavily bearish. A failure to hold current levels could open the door for a retest of deeper historical supports in the $80 range, whereas a sustained recovery requires reclaiming the $125 resistance zone.
Included In Lists
Related Tickers of Interest
BABA Weekly Chart
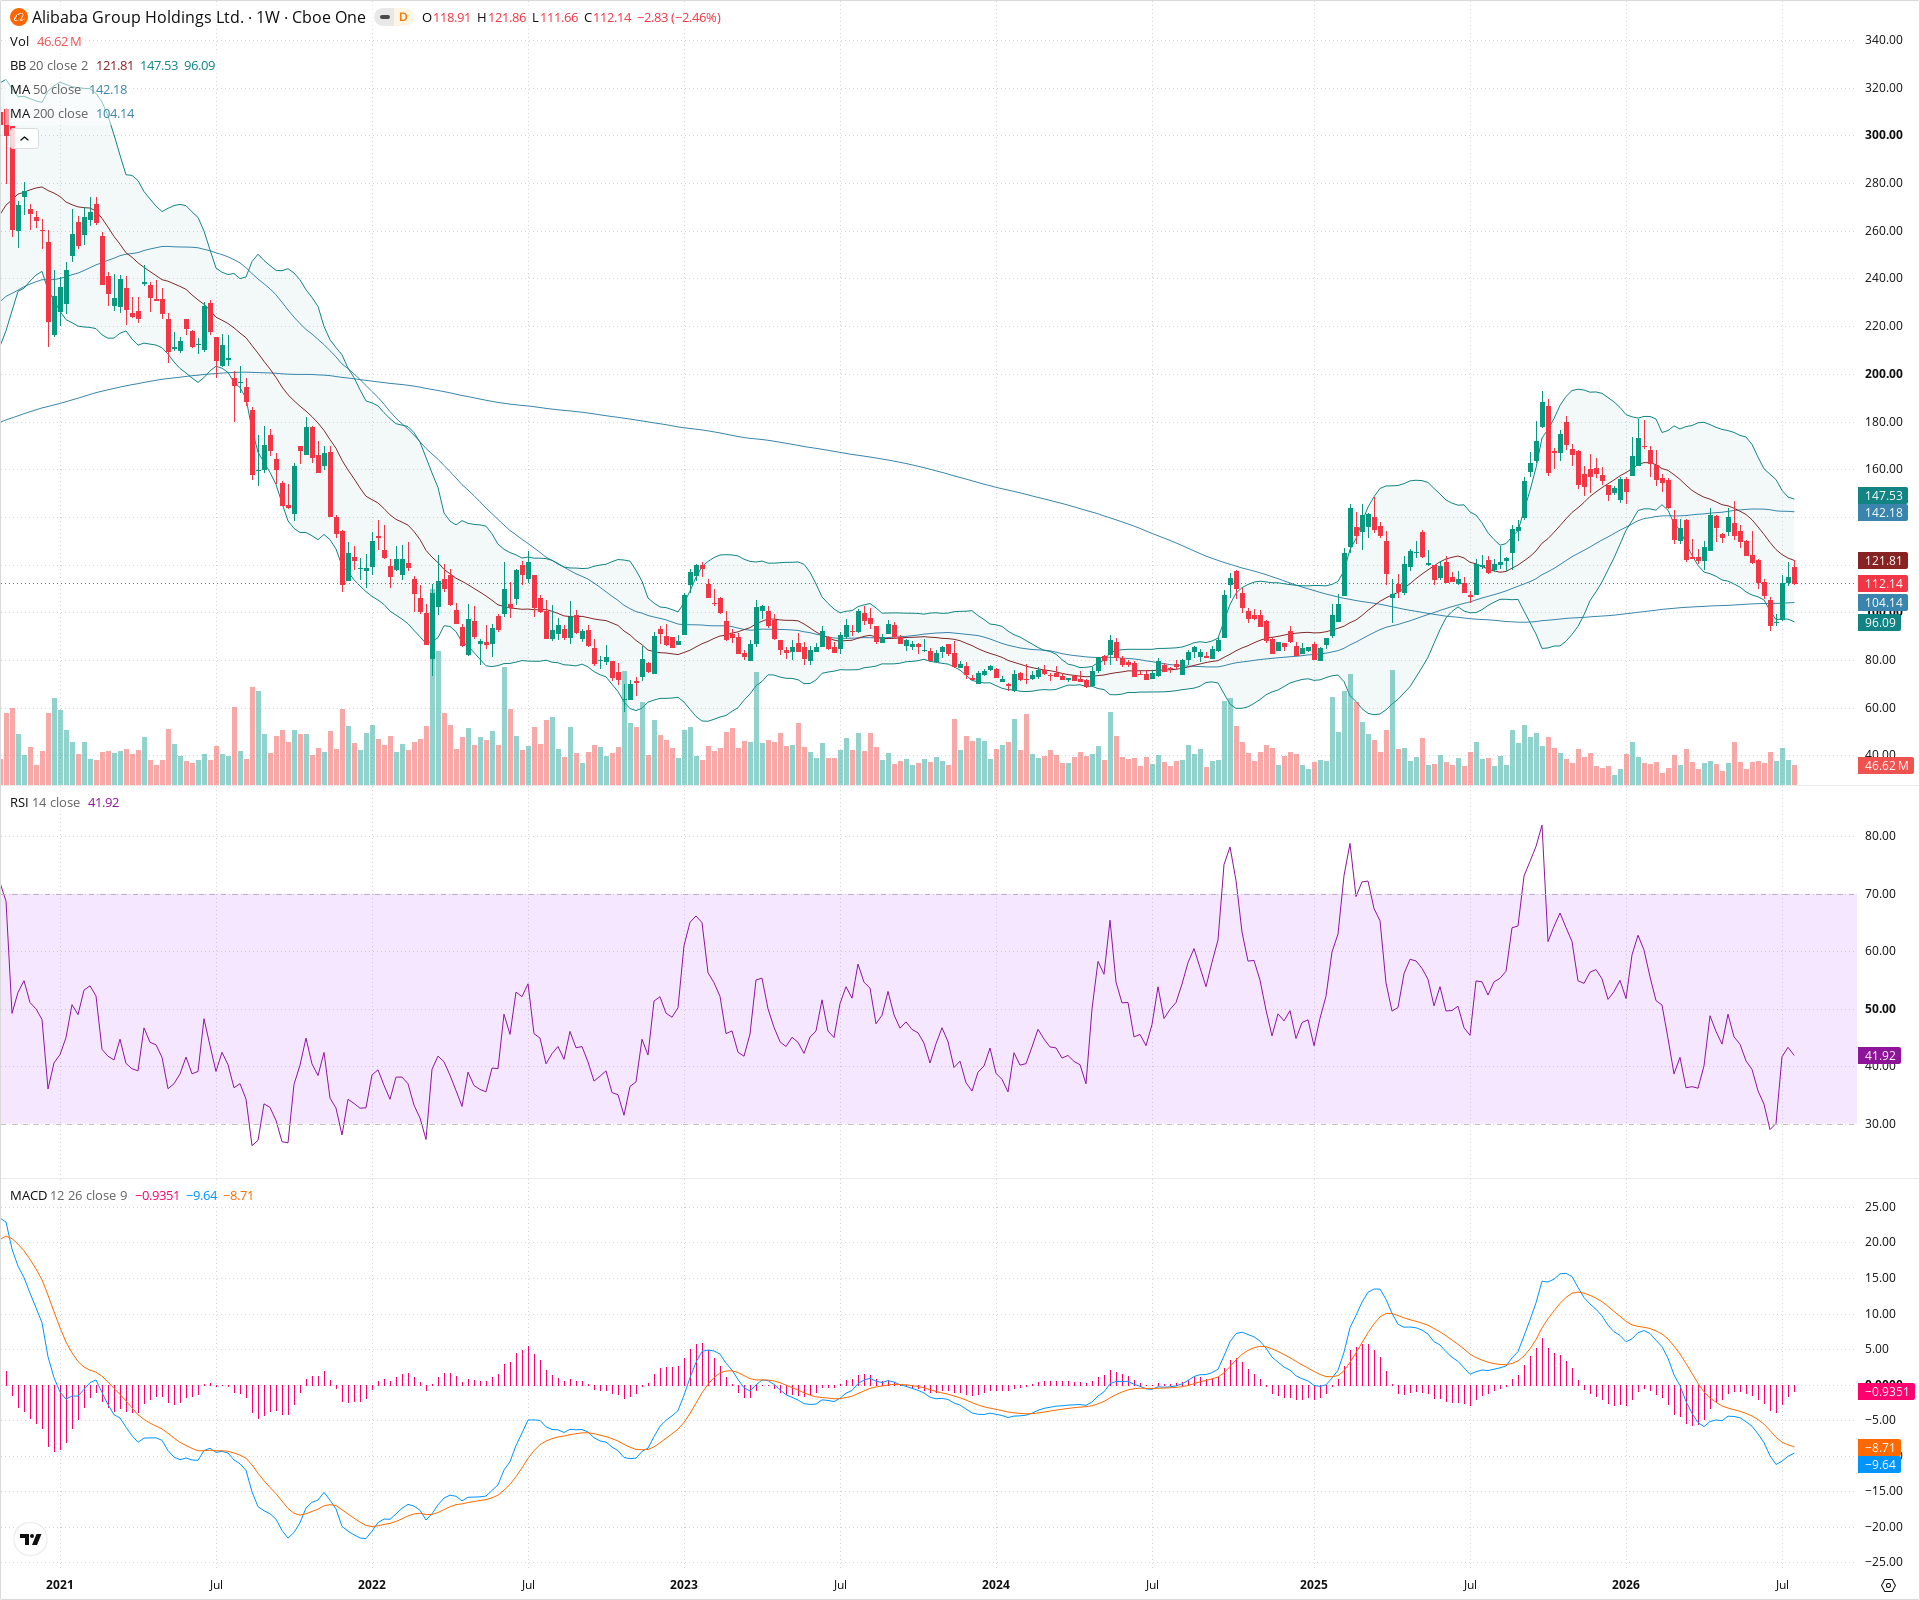
Sentiment
Short-term Sentiment (days to weeks): Bearish
Price has experienced a steep multi-week decline, breaking below the 20-week and 50-week SMAs, accompanied by a bearish MACD crossover and an expanding negative histogram.
Long-term Sentiment (weeks to months): Bearish
The stock formed a massive lower high structure (failing near $160 after the peak near $200) and subsequently broke down below crucial structural support around $120, resuming the broader macro downtrend.
Report Metadata
- Timeframe: weekly
- Generated at: 2026-07-25T09:13:43.800Z
- Model: gemini-3.1-pro-preview
Support Price Levels
| Level | Range | Strength | Notes |
|---|---|---|---|
| $102.50 | $100.00 - $105.00 | Strong | Crucial long-term support zone currently provided by the rising 200-week SMA. |
| $80.00 | $75.00 - $85.00 | Strong | Major historical consolidation zone and significant structural swing lows prior to the large rally. |
Resistance Price Levels
| Level | Range | Strength | Notes |
|---|---|---|---|
| $122.50 | $120.00 - $125.00 | Strong | Recent breakdown level, previous major support turned resistance, and the approximate location of the declining 20-week SMA. |
| $142.50 | $140.00 - $145.00 | Strong | Location of the 50-week SMA and previous structural support/consolidation area. |
Potential Chart Patterns in Formation
| Strength | Pattern | Signal | Target | Details |
|---|---|---|---|---|
| Strong | Distribution Top Breakdown | Bearish | $80.00 | After a massive rally, price formed a significant lower high near $160, followed by a decisive breakdown below the key $120 neckline/support area, confirming a trend reversal. |
Frequently Asked Questions about BABA
What is the current sentiment for BABA?
The short-term sentiment for BABA is currently Bearish because Price has experienced a steep multi-week decline, breaking below the 20-week and 50-week SMAs, accompanied by a bearish MACD crossover and an expanding negative histogram.. The long-term trend is classified as Bearish.
What are the key support levels for BABA?
StockDips.AI has identified key support levels for BABA at $102.50 and $80.00. These levels may represent potential accumulation zones where buying interest could emerge.
Is BABA in a significant dip or a Value Dip right now?
BABA has a Value Score of 52/100. It is not currently flagged as a significant dip in the Top Dips list. It is not listed as a Value Dip because the long-term sentiment or value-score threshold does not qualify.
View the full interactive analysis on StockDips.AI.